Master Filtering
- 5 minutes to read
`The Dashboard allows you to use any data-aware dashboard item as a filter for other dashboard items (Master Filter). The values of the selected elements (grid records, chart bars, pie segments, etc.) in the Master Filter item are then used as the filter values for data displayed in other dashboard items.
- Master Filter Items
- Master Filter Modes
- Filtering Across Data Sources
- Preventing Items From Being Filtered
- Apply Filtering
- Neutral Filter Mode
- Examples
Master Filter Items
A dashboard item falls in one of four groups regarding its ability to act as a master filter item (that is, to supply filter values) or to affect a filter in other way (that is, to isolate items and prevent them from being filtered).
Group | Items | Description |
|---|---|---|
Data Visualization Items | Specify the Master Filter mode to enable master filtering. | |
Combo Box | Designed to filter other dashboard items. Master Filtering is always enabled. You can change the selection type to select a single or multiple values, or allow an empty selection when no item is selected and the filter item does not affect other dashboard items. | |
List Box | ||
Tree View | ||
Range Filter | Displays a chart with selection thumbs and allows you to filter values on the argument axis. | |
Containers | Isolates master filter items inside the container from the master filter outside the container. | |
Master Filter Modes
A Master Filter item supports two selection modes:
- Multiple - Allows you to select multiple elements.
- Single - A single element is selected. You can change the selection, but you cannot clear it.
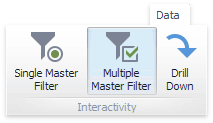
To enable/disable master filtering, use the Multiple Master Filter or Single Master Filter buttons in the Data ribbon tab page’s Interactivity group.
In code, use the DashboardItemInteractivityOptions.MasterFilterMode property.
Note
If a dashboard item contains different element types whose values can specify a master filter, the Target dimensions ribbon group allows you to select what element to use. For example, the Chart item provides the Arguments, Series and Points buttons.
Filtering Across Data Sources
When working with different data sources, you can create a Master Filter that applies a filter to a common field.
Fields should be at the same hierarchy level (their full names should match). For example, Customer.City and Customer.Address.City fields do not match..
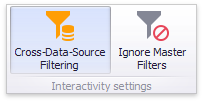
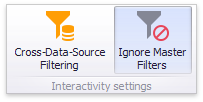
To enable filtering across data sources, use the Cross-Data-Source Filtering button in the Data Ribbon tab.
An example of cross-data-source filtering is shown in the Sales Performance module in the DashboardForWin MainDemo and in the Image Gallery below.
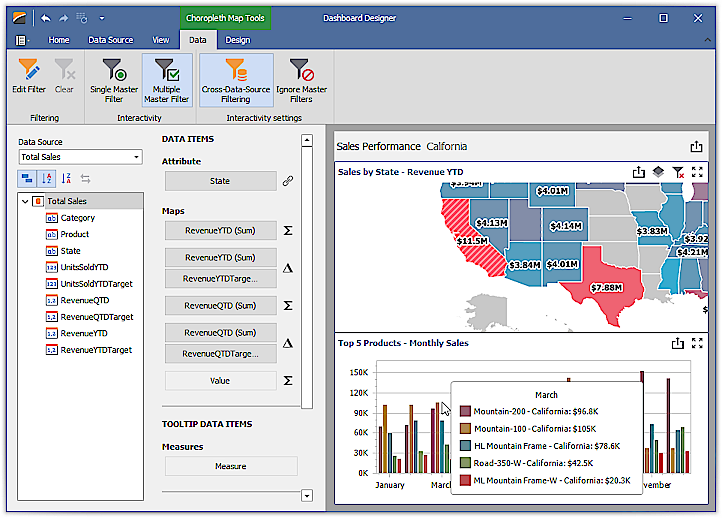
California is selected in the Map Master Filter bound to the Total Sales data source. Although the Top 5 Products chart is bound to another data source, it displays the California data, because Cross Data Source Filtering is enabled.
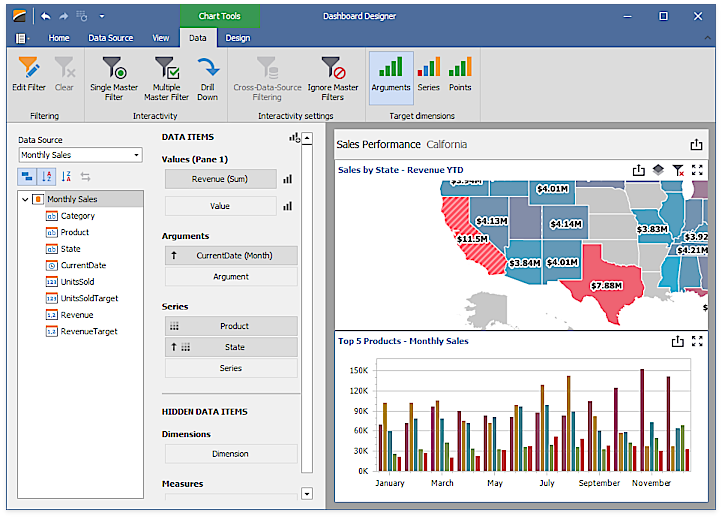
The Top 5 Products chart is bound to Monthly Sales data source. It contains the State field with the same name as the Total Sales data source field.
To enable filtering across data sources in code, set the DataDashboardItem.IsMasterFilterCrossDataSource property to true.
Note
Make sure that the matching field is visible in the dashboard item. You cannot use a hidden field to filter across data sources.
Filtering across data sources is used to implement Cascading Lookup With Master Filters.
Preventing Items From Being Filtered
You can prevent specific dashboard items from being affected by Master Filters. To do this, use the Ignore Master Filters button in the Data Ribbon tab.
To do this in code, use the FilterableDashboardItemInteractivityOptions.IgnoreMasterFilters property.
If an item is in a container (in the Dashboard Item Group or Tab Page), the container’s settings affect the master filter’s scope. If an item in a group or a tab page has the Ignore Master Filters option enabled, the item ignores master filters from items in the same container and applies master filters from items outside the container, including items from other groups or tab pages.
Apply Filtering
The DashboardDesigner.CanSetMasterFilter method allows you to determine whether master filtering can affect the specified dashboard item. Use the DashboardDesigner.GetAvailableFilterValues method (or the DashboardDesigner.GetEntireRange method for the Range Filter dashboard item) to obtain the values of all elements that can be selected.
To apply filtering in code, use the DashboardDesigner.SetMasterFilter method (or the DashboardDesigner.SetRange method for the Range Filter dashboard item).
The DashboardDesigner.MasterFilterSet event occurs after the Master Filter is applied to an item or the Master Filter state changes, . The MasterFilterSetEventArgs.SelectedValues and MasterFilterSetEventArgs.SelectedRange properties provide you with the selected values or the selected range of the dashboard item that causes the event.
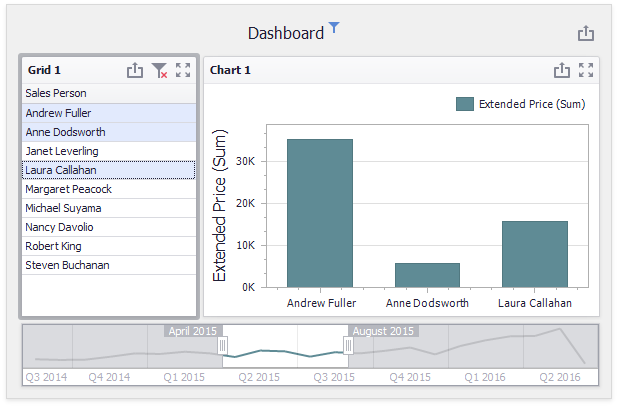
In the image above, three grid rows are selected. The event fires twice and the MasterFilterSetEventArgs.SelectedValues property returns “Andrew Fuller”, “Ann Dodsworth” and “Laura Callahan” for the Grid dashboard item. For the Range Filter dashboard item, the MasterFilterSetEventArgs.SelectedRange property returns minimum and maximum values in the selected range (“March, 1997” and “October, 1997”).
To clear the selection in the Master Filter item, use the DashboardDesigner.ClearMasterFilter method.
After the selection is cleared, the DashboardDesigner.MasterFilterCleared event is raised.
Neutral Filter Mode
The Neutral Filter Mode for filter elements does not apply any criteria to the data source when the filter element is initialized and displayed. This improves performance and usability.
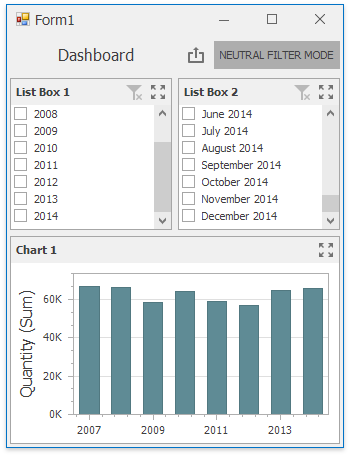
To switch to a new mode, use the Dashboard API. Refer to the Neutral Filter Mode topic for more information.
Examples
- How to: Apply Master Filtering in DashboardViewer
- How to: Apply Master Filtering in Code in OLAP Mode