Filtering
- 5 minutes to read
The Dashboard Designer allows you to filter data in the dashboard items or apply filters to a specific measure. Dimensions and hidden dimensions are used to build filter criteria.
Tip
See Filtering for common filtering concepts for web and desktop applications.
Dashboard Item Filter
Filters that apply to a dashboard item affect only this item. To add filters, select the target dashboard item and do one of the following:
Click the Edit Filter button in the Data tab in a Ribbon menu.
Right-click a dashboard item and select Edit Filter from its context menu.
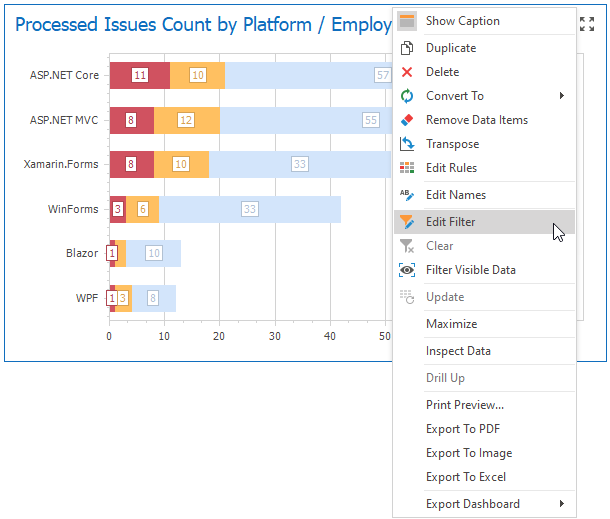
This invokes the Filter Editor dialog that allows you to build complex filter criteria:

Tip
Documentation: Filter Editor
To clear the applied filter, select Clear from the dashboard item’s context menu or click the Clear button in the Data Ribbon tab.
To specify the filter criteria in code, use the DataDashboardItem.FilterString property. See Expression Constants, Operators, and Functions for a list of functions.
The following code shows how to apply filtering to a dashboard item in code. Note that the DataItem.UniqueId property is specified for Dimension objects to identify these dimensions in a filter string.
ChartDashboardItem chart = new ChartDashboardItem();
Dimension issueTypeDimension = new Dimension("issueTypeID", "IssueType");
Dimension productNameDimension = new Dimension("productNameID", "ProductName");
Measure openedMeasure = new Measure("Opened", SummaryType.Count);

// ...

chart.FilterString = "issueTypeID = 'Critical' And productNameID In ('Web Forms', 'Mobile')";
Measure Filter
You can apply filters to individual measures. If you create multiple measures that only differ in applied filters, you can compare values calculated over different date-time periods or against different categories.
Select a dashboard item and right-click a measure to be filtered. Select Edit Filter from its context menu.

This invokes the Filter Editor dialog where you can specify filter criteria:

The filtered measure has the Filter icon:
![]()
Tip
Documentation: Filter Editor
To clear the applied filter, select Clear from the measure’s context menu.
Note
The measure filter is technically an expression that uses the filter(summaryExpression, filterCriteria) function where summaryExpression is a measure to be filtered and filterCriteria is a filter. See Expression Constants, Operators, and Functions for more information about functions you can use in dashboard expressions.
The image below shows a Chart with three measures:
- 2019 - Opened is filtered by year 2019.
- 2020 - Opened is filtered by year 2020.
- Opened is the original measure without filters.

Visible Data Filter
You can specify a Visible Data Filter to limit displayed data. This filter type does not filter underlying data used in calculations or intermediate level aggregations.
Click the Set Visible Data Filter button in the Data tab in a Ribbon menu to invoke the Visible Data Filter Editor where you can set a filter condition:

For example, a Grid dashboard item has 35 rows and displays sales percentages.

The image below shows the difference between filters (the filter condition is the same):
- Dashboard Item Filter: sales percentages are re-calculated based on the visible data.
- Visible Data Filter: sales percentages remain the same because this filter type does not affect calculations.

Pass Parameter Values
You can use the Filter Editor to filter a dashboard item according to the current parameter value. See the Pass Parameter Values topic for details.
OLAP Filtering Specifics
You cannot apply filtering by building complex filter criteria in OLAP mode. Instead, you can filter dimension attributes and hierarchies by manually selecting the values you wish (or do not wish) to include in the dashboard.
Dimension Attribute | Dimension Hierarchy |
|---|---|
For dimension attributes, the Filter Editor contains a list of all values.
| For hierarchies, a tree is displayed instead, allowing you to filter individual values at any hierarchy level.
|


To specify the filter criteria in code in OLAP mode, you can use the DataDashboardItem.FilterString property.
The filter expression contains logical operators that accept specified operands. You can use the following operands in filter criteria expressions.
- OLAP cube fields are passed to filter expressions using the OperandProperty operand. Unique names of OLAP members are used to pass the database field to the filter expression.
- Constant values are passed to filter expressions using the ConstantValue operand. Note that the unique names of OLAP members are used.
- Dashboard parameter values are passed using the OperandParameter operand. To filter according to the dashboard parameter value, pass the required parameter’s name (Parameter.Name) to the OperandParameter constructor.
The following criteria operators are supported in OLAP mode.
- InOperator
- NotOperator
-
The binary operator only supports the BinaryOperatorType.Equal type.
-
The group operator can accept any of the supported operators with the following restrictions for data members from the OLAP data source (DataItem.DataMember).
- Child operands of the GroupOperator should contain property operands (OperandProperty) with names belonging to the specified data member or data members from the specified dimension hierarchy.
- If the GroupOperator is the root operator in the filter criteria, and its type is GroupOperatorType.And, its child operands can contain property operands (OperandProperty) with property names belonging to different data members.
After the filter criteria is constructed, convert it to a string using the CriteriaOperator.ToString method and assign this string to the DataDashboardItem.FilterString property.
API Members
| API | Description |
|---|---|
| DataDashboardItem.FilterString | Gets or sets the criteria string used to filter data displayed within the current dashboard item. |