Filtering
- 4 minutes to read
The Dashboard allows you to filter a query of the SQL Data Source, the entire Excel Data Source/Object Data Source/Extract Data Source or apply filtering to a specific data-aware dashboard item.
This topic describes how to enable and reset filtering for individual dashboard items.
Apply Filtering
To configure filtering in the Designer, select the target dashboard item and do one of the following.
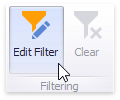
If you are using a Ribbon menu, click the Edit Filter button in the Data tab.
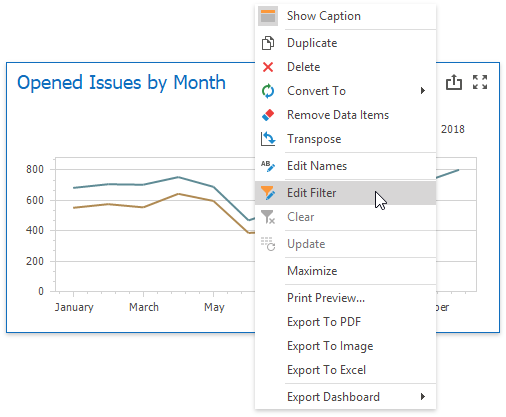
Right-click a dashboard item and select Edit Filter from its context menu.
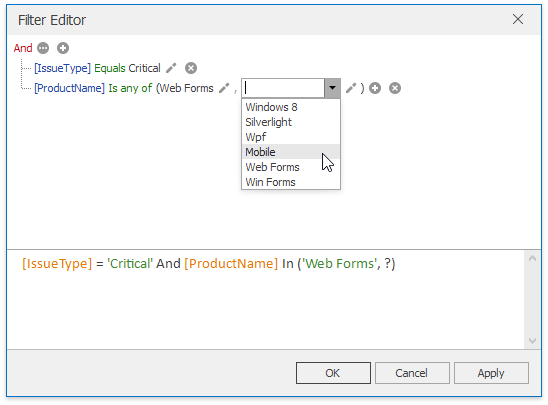
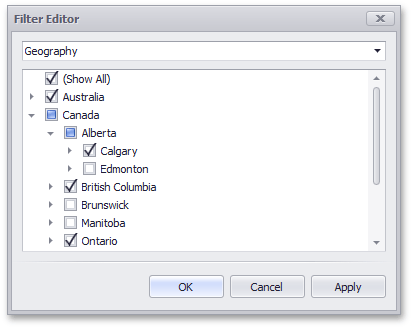
This will invoke the Filter Editor dialog. The dialog allows you to build complex filter criteria with a convenient tree-like interface. The bottom text panel can be used to enter filter expressions manually and provides syntax highlighting and autocomplete features.
Note
Note that you can use hidden dimensions within the Filter Editor dialog, allowing you to filter data based on the values.
To clear the applied filter, select Clear from the dashboard item’s context menu or click the Clear button in the Data Ribbon tab.
To specify the filter criteria in code, use the DataDashboardItem.FilterString property. To learn how to build filter criteria, see Expression Constants, Operators, and Functions.
The following code shows how to apply filtering to a dashboard item in code. Note that the DataItem.UniqueId property is specified for Dimension objects to identify these dimensions in a filter string.
ChartDashboardItem chart = new ChartDashboardItem();
Dimension issueTypeDimension = new Dimension("issueTypeID", "IssueType");
Dimension productNameDimension = new Dimension("productNameID", "ProductName");
Measure openedMeasure = new Measure("Opened", SummaryType.Count);

// ...

chart.FilterString = "issueTypeID = 'Critical' And productNameID In ('Web Forms', 'Mobile')";
Pass Parameter Values
You can use the Filter Editor to filter a data source according to the current parameter value. To learn more, see the Passing Parameter Values topic.
How to: Pass a Dashboard Parameter to a Filter String in Code
OLAP Filtering Specifics
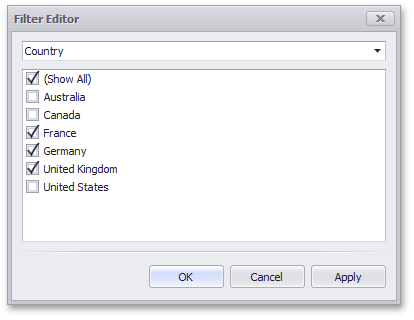
You cannot apply filtering by building complex filter criteria in OLAP mode. Instead, you can filter dimension attributes and hierarchies by manually selecting the values you wish (or do not wish) to include in the dashboard.
Dimension Attribute | Dimension Hierarchy |
|---|---|
For dimension attributes, the Filter Editor contains a list of all values.
| For hierarchies, a tree is displayed instead, allowing you to filter individual values at any hierarchy level.
|
To specify the filter criteria in code in OLAP mode, you can use the DataDashboardItem.FilterString property.
The filter expression contains logical operators that accept specified operands. You can use the following operands in filter criteria expressions.
- OLAP cube fields are passed to filter expressions using the OperandProperty operand. Unique names of OLAP members are used to pass the database field to the filter expression.
- Constant values are passed to filter expressions using the ConstantValue operand. Note that the unique names of OLAP members are used.
- Dashboard parameter values are passed using the OperandParameter operand. To filter according to the dashboard parameter value, pass the required parameter’s name (Parameter.Name) to the OperandParameter constructor.
The following criteria operators are supported in OLAP mode.
- InOperator
- NotOperator
-
The binary operator only supports the BinaryOperatorType.Equal type.
-
The group operator can accept any of the supported operators with the following restrictions for data members from the OLAP data source (DataItem.DataMember).
- Child operands of the GroupOperator should contain property operands (OperandProperty) with names belonging to the specified data member or data members from the specified dimension hierarchy.
- If the GroupOperator is the root operator in the filter criteria, and its type is GroupOperatorType.And, its child operands can contain property operands (OperandProperty) with property names belonging to different data members.
After the filter criteria is constructed, convert it to a string using the CriteriaOperator.ToString method and assign this string to the DataDashboardItem.FilterString property.
How to: Filter Dashboard Item’s Data in OLAP Mode