Providing Data
- 4 minutes to read
The Dashboard Designer allows you to bind various dashboard items to data in a virtually uniform manner. To learn more, see the Binding Dashboard Items to Data topic.
The only difference is in the data sections that the required dashboard item has. This topic describes how to bind a Gauge dashboard item to data in the Designer or in code.
Binding to Data in the Designer
The image below shows a sample Gauge dashboard item that is bound to data.
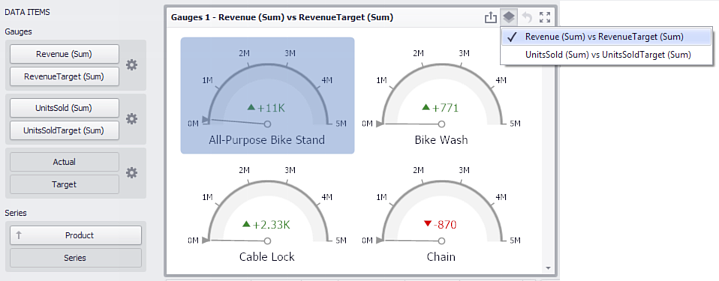
To bind the Gauge dashboard item to data, drag and drop a data source field to a placeholder contained in one of the available data sections. A table below lists and describes Gauge’s data sections.
Section | Processed as | Description |
|---|---|---|
Gauges | Measure (both Actual and Target values) | Contains data items used to calculate values displayed by gauges. Data items are arranged in containers. Each data item container can hold two data items. The first item contains actual data and the second item (optional) contains target data. If both items are provided, gauges show the difference between actual and target values. You can fill several data item containers in the Gauges section and use the Values drop-down menu to switch between the provided values. To invoke the Values menu, click the Note This drop-down menu is available if the Series section is not empty. Otherwise, a separate gauge is created for each data item container, and all gauges are displayed simultaneously. |
Series | Contains data items whose values are used to label gauges. |
 icon in the dashboard item caption.
Binding to Data in Code
To provide data for the Gauge dashboard item, use the following properties.
Series | |
Values | To provide data used to calculate values displayed by gauges, do the following.
|
Example
The following example demonstrates how to bind a Gauge dashboard item to data in code.
Note
A complete sample project is available at https://github.com/DevExpress-Examples/how-to-bind-a-gauge-dashboard-item-to-data-in-code-e4771.
Imports System
Imports System.Windows.Forms
Imports DevExpress.DashboardCommon
Imports DevExpress.DataAccess

Namespace Dashboard_CreateGauges
    Partial Public Class Form1
        Inherits Form

        Public Sub New()
            InitializeComponent()
        End Sub
        Private Function CreateGauges(ByVal dataSource As DashboardObjectDataSource) As GaugeDashboardItem

            ' Creates a gauge dashboard item and specifies its data source.
            Dim gauges As New GaugeDashboardItem()
            gauges.DataSource = dataSource

            ' Creates the Gauge object with measures that provide data for calculating actual and target
            ' values, and then adds this object to the Gauges collection of the gauge dashboard item.
            Dim gauge As New Gauge()
            gauge.ActualValue = New Measure("Extended Price", SummaryType.Average)
            gauge.TargetValue = New Measure("Extended Price", SummaryType.Max)
            gauges.Gauges.Add(gauge)

            ' Specifies the dimension that provides data for a gauge dashboard item series.
            gauges.SeriesDimensions.Add(New Dimension("Sales Person"))

            Return gauges
        End Function
        Private Sub Form1_Load(ByVal sender As Object, ByVal e As EventArgs) Handles MyBase.Load

            ' Creates a dashboard and sets it as the currently opened dashboard in the dashboard viewer.
            dashboardViewer1.Dashboard = New Dashboard()

            ' Creates a data source and adds it to the dashboard data source collection.
            Dim dataSource As New DashboardObjectDataSource()
            dataSource.DataSource = (New nwindDataSetTableAdapters.SalesPersonTableAdapter()).GetData()
            dashboardViewer1.Dashboard.DataSources.Add(dataSource)

            ' Creates a gauge dashboard item with the specified data source
            ' and adds it to the Items collection to display within the dashboard.
            Dim gauges As GaugeDashboardItem = CreateGauges(dataSource)
            dashboardViewer1.Dashboard.Items.Add(gauges)

            ' Reloads data in the data sources.
            dashboardViewer1.ReloadData()
        End Sub
    End Class
End Namespace