Panes
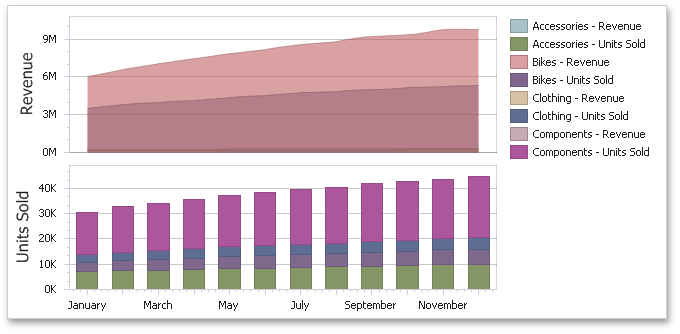
The Chart dashboard item can contain any number of panes. Panes are visual areas within a diagram that display chart series.
Each pane has its own Y-axis and displays a specific set of series. All panes in a chart share the same X-axis.
Adding Panes
To add a pane, click the Add Pane button (the  icon) at the top right of the DATA ITEMS pane.
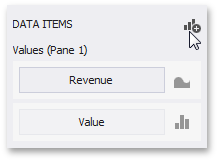
Once a new pane is added, the Dashboard Designer creates another Values section in the DATA ITEMS pane.
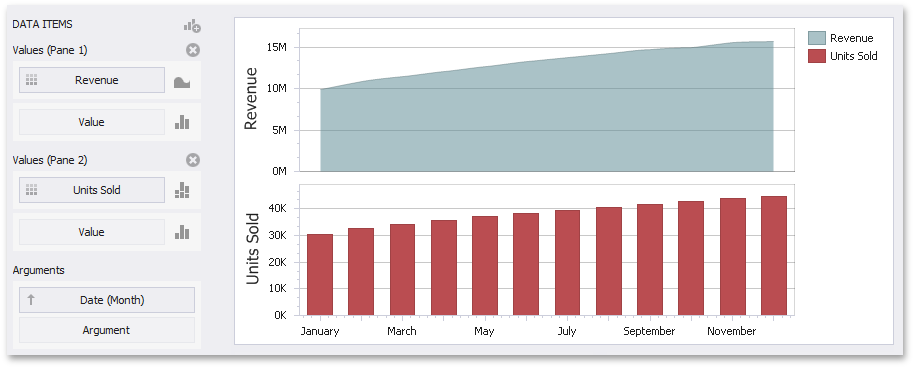
Use this section to provide data items that supply values to be displayed in the new pane (see Providing Data for details on data binding).
To remove a pane, click the Remove Pane button (the  icon) displayed in the corresponding Values section.
Adding Panes in Code
To access panes in code, use the ChartDashboardItem.Panes collection. This collection contains ChartPane objects, which represent panes. You can add new panes to this collection and remove existing panes from the collection.
ChartPane objects provide access to the collection of series displayed within the pane (ChartPane.Series), as well as the pane’s Y-axis (ChartPane.PrimaryAxisY).