Create a Dashboard in the Web Dashboard
- 3 minutes to read
This lesson demonstrates how to create a dashboard in the Web Dashboard Designer application prepared in one of the tutorials.
Steps 1-7. Create a Dashboard
At the startup, your web application does not display any dashboard:
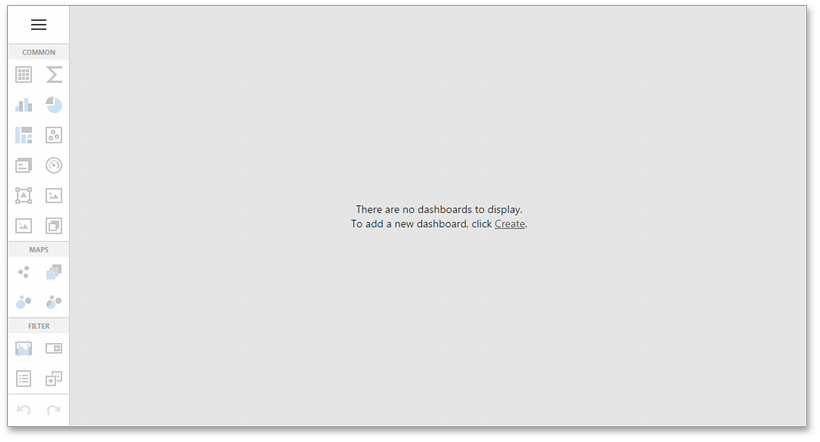
Click Create in the designer’s surface.
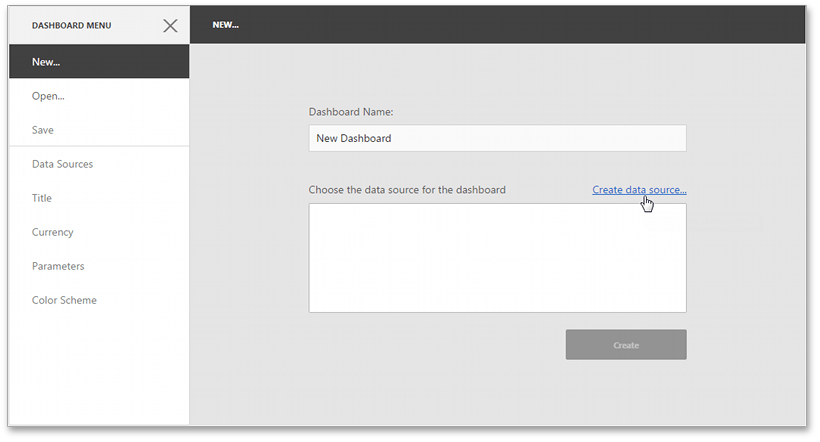
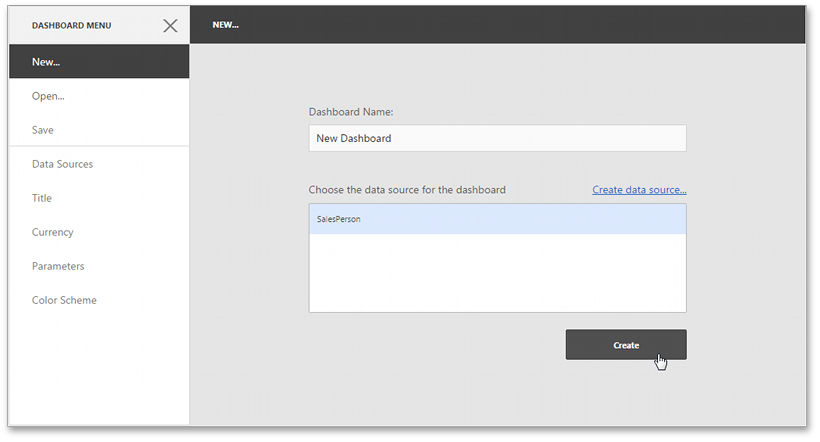
Click the Create Data Source… button in the New page.
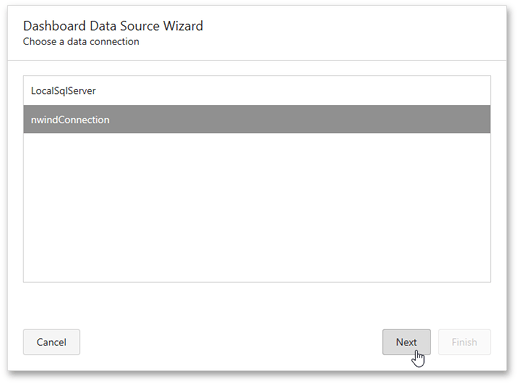
Select the nwindConnection in the invoked Dashboard Data Source Wizard.
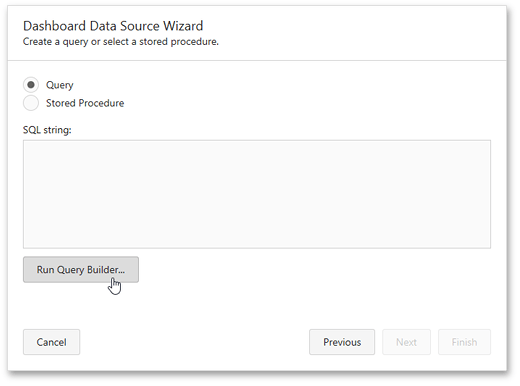
Click Run Query Builder… on the next page.
In the invoked Query Builder, drag the SalesPerson view from Available Tables and Views on the right and drop it onto the empty surface. Enable the *(All Columns) check box.
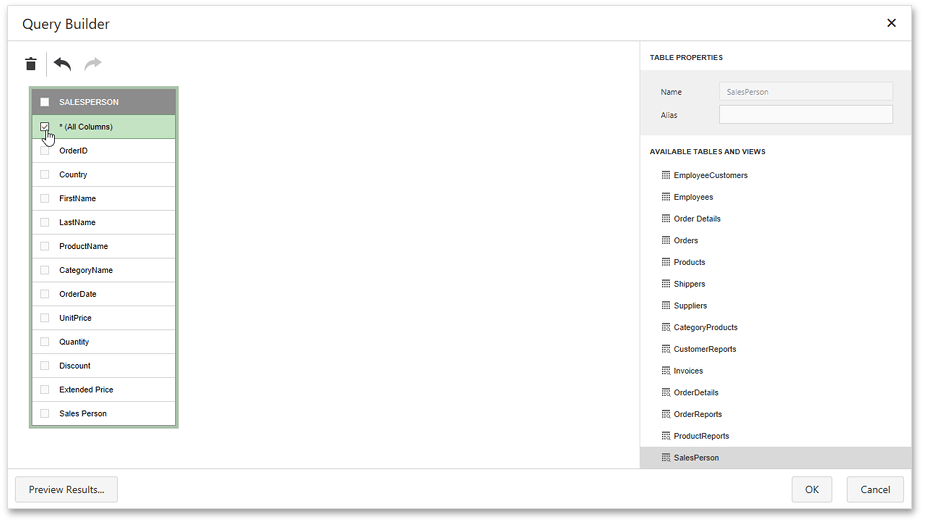
Click OK.
The Data Source wizard now displays the generated query.
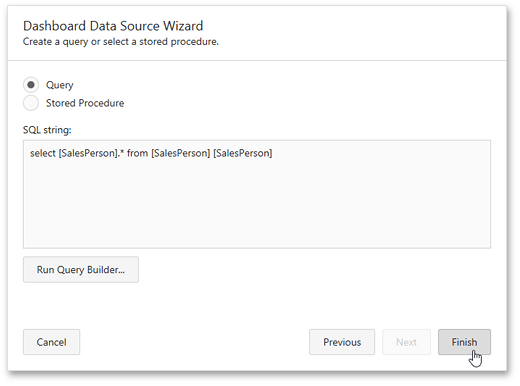
Click Finish.
Finally, click the Create button to create a dashboard with the newly created data source.
Steps 8-10. Create Dashboard Items
To create a dashboard item in the Web Dashboard, click the corresponding button in the Toolbox.
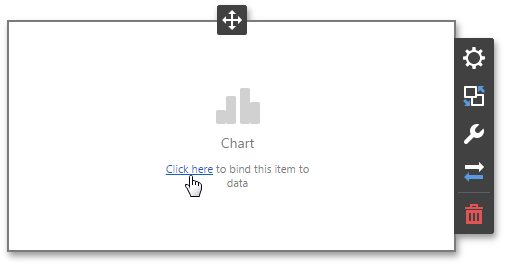
Click the Chart button to add a chart.

Select the created Chart and click the link on its surface to bind it to data.
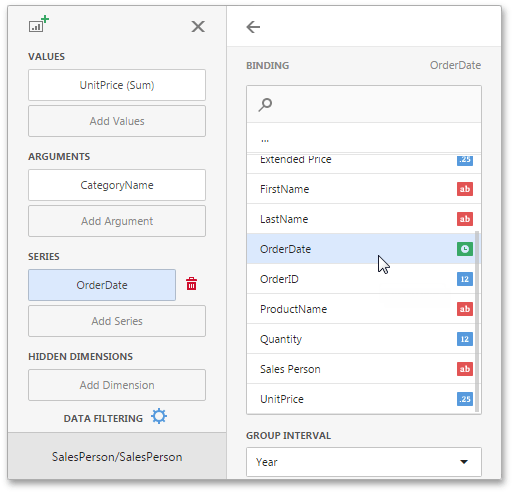
In the opened Binding menu select the Add Values placeholder. Click the UnitPrice field to add it to the Values section. In the same way, add the CategoryName field to the Arguments section and the OrderDate field to the Series section.
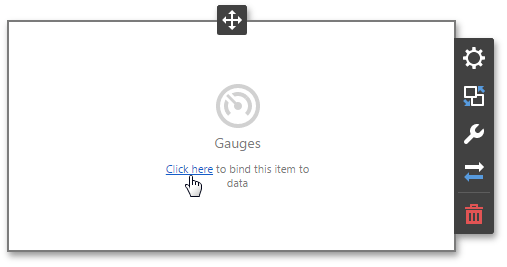
Click the Gauges button in the Toolbox to add gauges.

Select the created Gauge and click the link on its surface to bind it to data.
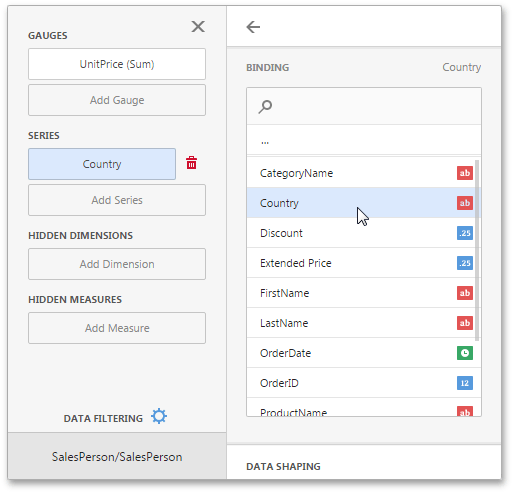
In the opened Binding menu select the Add Gauge placeholder. Click the UnitPrice field to add it to the Gauges section. In the same way, add the Country field to the Series section.
Click the Card button in the Toolbox to add cards.

Select the created Card and click the link on its surface to bind it to data.

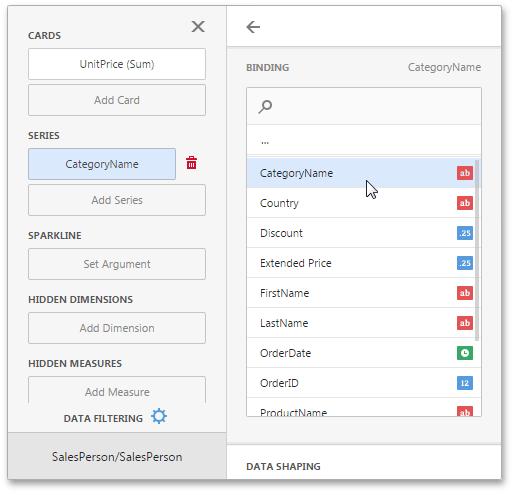
In the opened Binding menu, select the Add Card placeholder. Click the UnitPrice field to add it to the Cards section. In the same way, add the CategoryName field to the Series section.
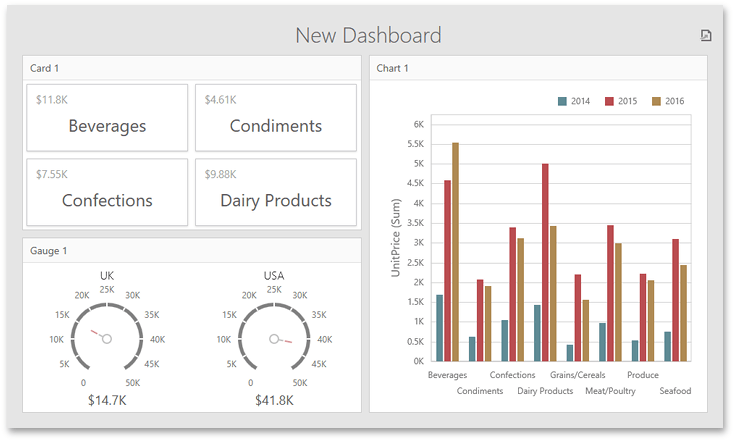
The dashboard should look like this:
Step 11. Save the Dashboard
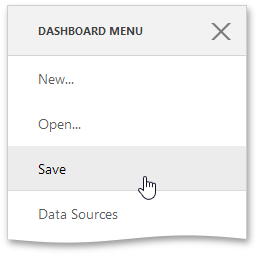
Open the dashboard menu and click Save. The dashboard XML file is saved to the previously created storage (App_Data).
The dashboard is now ready. Refer to tutorials in the following section: Build End-User Dashboard Viewer Applications to learn how to embed a dashboard in a Viewer application.