Providing Data
- 2 minutes to read
The Web Dashboard allows you to bind dashboard items to data in a uniform and similar manner. See the Bind Dashboard Items to Data in the Web Dashboard’s UI topic for common information.
The difference is in the data sections that the specific dashboard item has. This topic describes how to bind the Pie dashboard item to data.
Binding to Data in the Web Dashboard
The image below shows a sample Pie dashboard item that is bound to data.
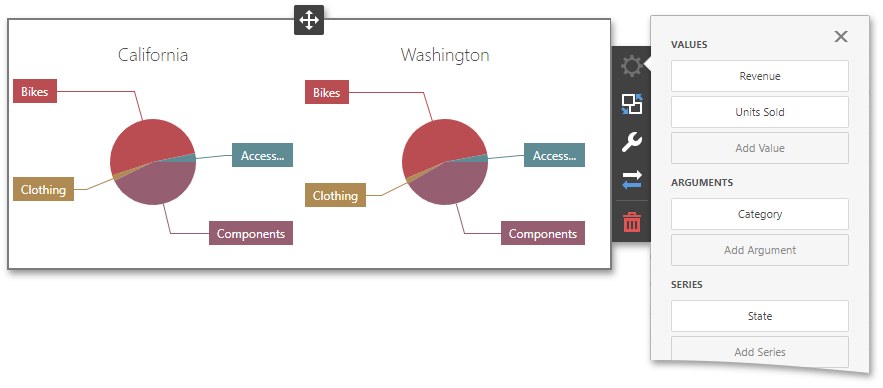
To bind the Pie dashboard item to data, click a placeholder contained in one of the available data sections and select the required data source field in the Binding section of the invoked data item menu.
The table below lists and describes the Pie’s data sections.
Section | API | Processed as | Description |
|---|---|---|---|
Values |
Note In case of negative measure values, Pie uses their absolute values. | Contains data items that define the share of pie segments. | |
Arguments | Contains data items that provide values used to label pie segments. | ||
Series | Contains data items whose values are used to label pie charts. |
The following example shows how to create the Pie dashboard item, bind it to data and add to the existing dashboard.
Create data items (measures and dimensions) and use the DataItem.dataMember property to bind them to the existing data source’s columns. Then use the created measures and dimensions in the dashboard item to bind it to data.
After you add the created dashboard item to the Dashboard.items collection, call the Dashboard.rebuildLayout method to rebuild the dashboard layout and display changes.
// Use the line below for a modular approach:
// import * as Model from 'devexpress-dashboard/model'
// Use the line below for an approach with global namespaces:
// var Model = DevExpress.Dashboard.Model;

// ...
public createPieItem() {
    // Create data items for the Pie dashboard item.
    var pieCategoryName = new Model.Dimension();
    pieCategoryName.dataMember("CategoryName");
    var pieProductName = new Model.Dimension();
    pieProductName.dataMember("ProductName");
    var pieCountry = new Model.Dimension();
    pieCountry.dataMember("Country");
    var pieUnitPrice = new Model.Measure();
    pieUnitPrice.dataMember("UnitPrice");

    // Create the Pie dashboard item and bind it to data.
    var pieItem = new Model.PieItem();
    pieItem.name('pies');
    pieItem.dataSource(sqlDataSource.componentName());
    pieItem.dataMember(sqlDataSource.queries()[0].name());

    pieItem.arguments.push(pieCategoryName, pieProductName);
    pieItem.values.push(pieUnitPrice);
    pieItem.seriesDimensions.push(pieCountry);

    pieItem.interactivityOptions.isDrillDownEnabled(true);

    control.dashboard().items.push(pieItem);
    // ...
    control.dashboard().rebuildLayout();

}