Coloring
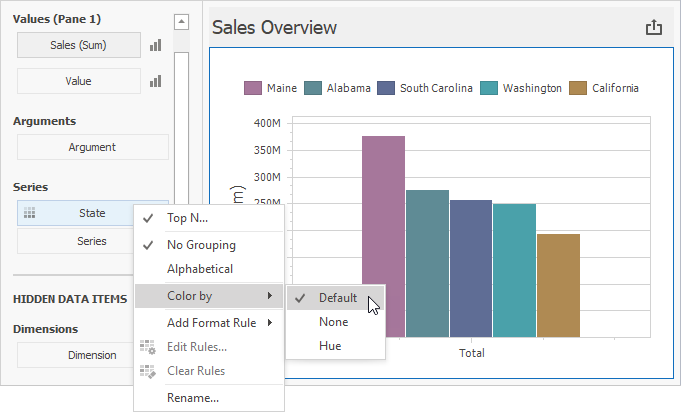
The Chart dashboard item paints different measures and series dimensions by hue in Default color mode. The image below shows the chart item whose State series dimension values are painted in different colors. A special icon ( ) on the data item shows that color variation is enabled.
To access Chart color options in code, use the ChartDashboardItemBase.ColoringOptions property.
The Chart dashboard item does not support color variation for the financial series.
You can also use conditional formatting for the Chart item to highlight chart elements such as bars, lines, areas, and data points. More information: Conditional Formatting.