Providing Data
- 3 minutes to read
The Dashboard Designer allows you to bind various dashboard items to data in a virtually uniform manner. To learn more, see the Binding Dashboard Items to Data topic. The only difference is in the data sections that the required dashboard item has. This topic describes how to bind a Treemap dashboard item to data in the Designer or in code.
The Treemap dashboard item has the Values and Arguments data sections that provide numeric and discrete categorical data, respectively. The steps below provide the most common scenarios of binding a Treemap to data.
Drop the Sales and Profit fields to the Values section.
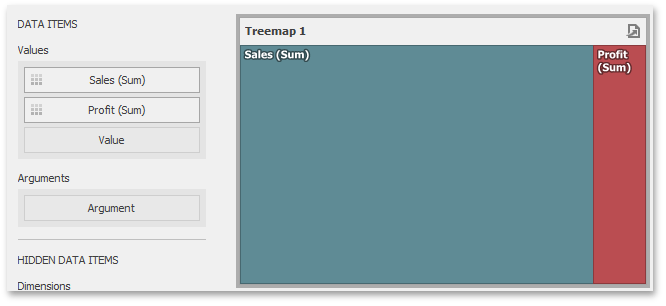
The Treemap will draw two tiles whose sizes correspond to the Sales and Profit summary values.
Drop the Product Category field to Arguments.
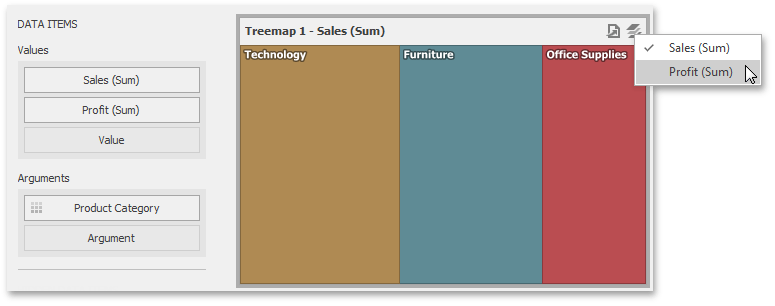
Treemap will create individual tiles for all categories. You can switch between Sales and Profit values by clicking the
 icon in the item’s caption or you can use its context menu.
Drop the child Product Sub-Category field into Arguments.
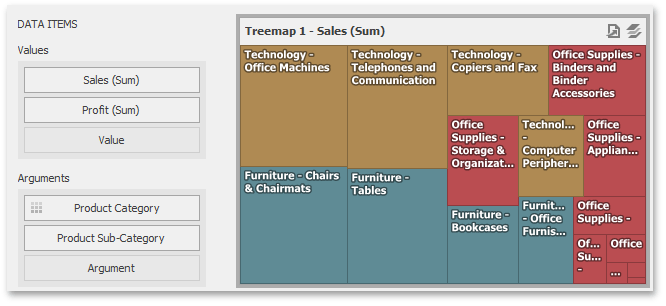
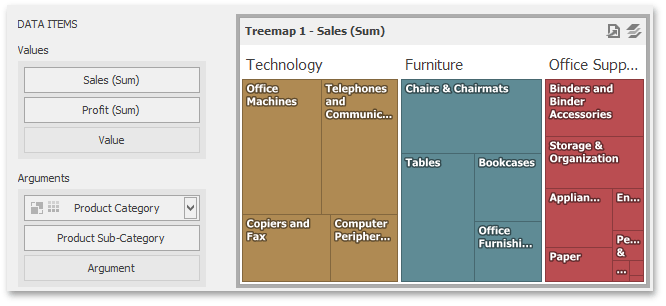
The Treemap will visualize all combinations of categories and corresponding sub-categories using individual tiles.
If the Arguments section contains several dimensions, you can group child tiles by values of the parent dimension. To group sub-categories inside corresponding categories, click the CategoryName menu button and select Group Tiles.
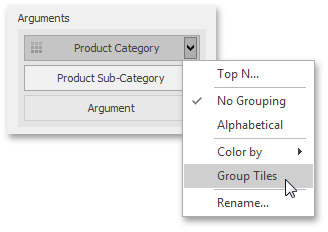
Sub-category tiles will be grouped into category groups.
Providing Data in Code
To provide data for the Treemap dashboard item, use the following properties.
Values | |
Arguments | TreemapDashboardItem.Arguments Note To group tiles by values of a specific dimension, enable the Dimension.GroupChildValues flag for this dimension. |
Example
The following example demonstrates how to bind a Treemap dashboard item to data in code.
Note
A complete sample project is available at https://github.com/DevExpress-Examples/how-to-bind-a-treemap-dashboard-item-to-data-in-code-t429531.
using DevExpress.DashboardCommon;
using DevExpress.XtraEditors;

namespace DashboardViewer_Treemap {
    public partial class Form1 : XtraForm {
        public Form1() {
            InitializeComponent();

            Dashboard dashboard = new Dashboard();

            DashboardExtractDataSource dataSource = new DashboardExtractDataSource();
            dataSource.FileName = @"..\..\Data\SalesDataExtract.dat";
            dashboard.DataSources.Add(dataSource);

            TreemapDashboardItem treeMap = new TreemapDashboardItem();
            treeMap.DataSource = dataSource;
            treeMap.Values.Add(new Measure("Sales"));
            treeMap.Arguments.Add(new Dimension { DataMember = "Product Category", GroupChildValues = true });
            treeMap.Arguments.Add(new Dimension("Product Sub-Category"));
            treeMap.LayoutAlgorithm = DashboardTreemapLayoutAlgorithm.Striped;

            dashboard.Items.Add(treeMap);
            dashboardViewer1.Dashboard = dashboard;
        }
    }
}