Calculated Fields
- 4 minutes to read
The DevExpress Dashboard provides the capability to create calculated fields that allow you to apply complex expressions to data fields that are obtained from the data source. You can create calculated fields at three levels: underlying, summary and intermediate.
Underlying Level
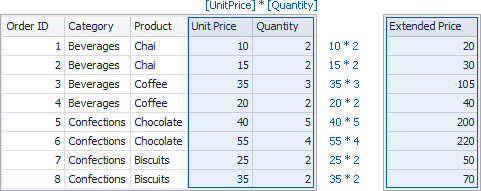
In the image below, the ExtendedPrice field is calculated based on underlying values of UnitPrice and Quantity.
After you drop the created calculated field along with Product to the Grid dashboard item, the Dashboard will summarize its data using the specified summary function.
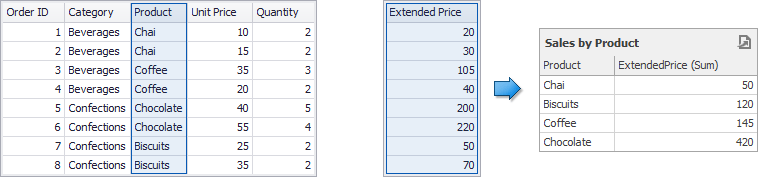
In this case, a calculation is performed before an aggregation.
Summary Level
You can also compute values of calculated fields on a visualization (or summary) level. In this case, the Dashboard computes calculated field values using displayed data.
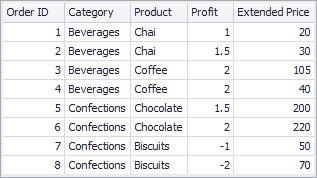
The underlying data source below contains the Profit and ExtendedPrice fields.
If you want to calculate a margin, you need to divide the sum of Profit values into the sum of ExtendedPrice values. To do this, you can use the set of aggregate functions (Sum, Min, Max, etc.) that allow you to perform calculations on a visualization level.
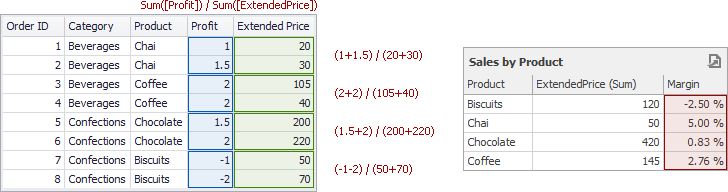
In this case, a calculation is performed after an aggregation.
Intermediate Level
Finally, you can create custom aggregations at different levels and combine these aggregations with existing visualizations. This can be done using the Aggr function that aggregates and summarizes underlying data using the detail level specified by a predefined set of dimensions and a specified summary function. The Aggr function has the following syntax.
Aggr(summaryExpression, dimension1, dimension2, ...)
The first argument is a summary expression calculated against a specific data source field. The next arguments are the set of dimensions whose values are aggregated and used to calculate summaries specified using the first argument. For instance, the following function calculates sums of sales for each product within the specified category.
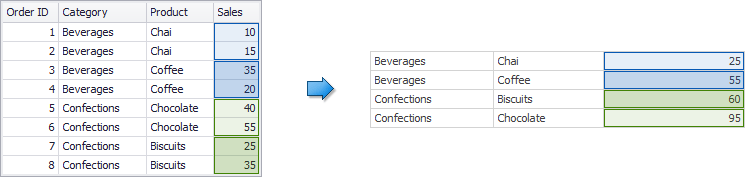
Aggr(Sum([Sales]), [Category], [Product])
If you created the calculated field that includes the Aggr function and dropped the created field into an existing dashboard item, the Dashboard joins the resulting aggregation with the already displayed data. This means that you can add data with increased or decreased granularity to the dashboard item. There are two main scenarios.
In the first scenario, an aggregation has a less detailed granularity than visualized data.
In this scenario, an underlying data source contains the list of orders for two categories and corresponding products.
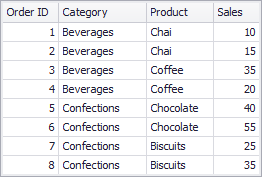
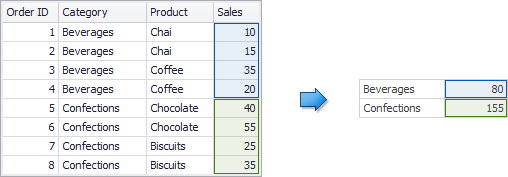
To aggregate this data by individual categories, create a calculated field with the following expression.
Aggr(Sum([Sales]), [Category])The following internal table will be generated for this calculated field.
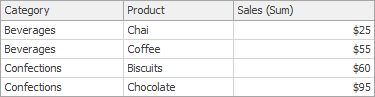
The sample Grid dashboard item contains more detailed data and includes the following columns: Category, Product and the sum of Sales.
If you drop the created calculated field to the Grid, the sum of sales for each category will be repeated for each Grid row.
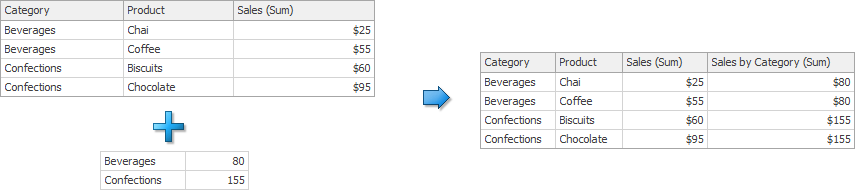
For instance, you can use these values later to calculate the contribution of each product to a category’s sales.
An aggregation has a more detailed granularity than visualized data.
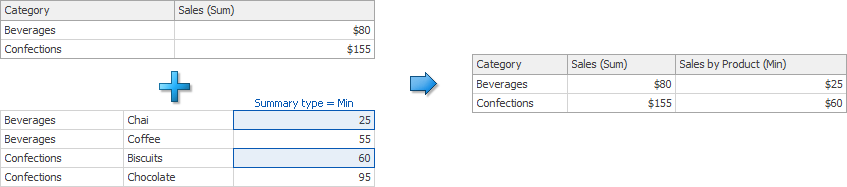
To aggregate this data by categories and products, create a calculated field with the following expression.
Aggr(Sum([Sales]), [Category], [Product])The following internal table will be generated for this calculated field.
Drop the created calculated field to the Grid and set its summary type to Min. The Grid will display minimum product sales within each category.
To learn more about typical use cases of utilizing the Aggr function, see Intermediate Level Aggregations.
How to Create a Calculated Field
The following topics show how to create calculated fields.