Conditional Formatting
- 3 minutes to read
The DevExpress Dashboard allows you to format dashboard item elements whose values meet a specified condition. This feature allows you to highlight specific elements using a predefined set of rules.
- Conditional Formatting Overview
- How to Apply Conditional Formatting
- How to Apply Conditional Formatting in Code
Conditional Formatting Overview
Comparison rules used in conditional formatting can be divided into the following groups.
| Format Condition | Description | Example | Condition class |
|---|---|---|---|
| Value | Allows you to compare static values (such as Greater Than, Less Than, Between, etc.). | 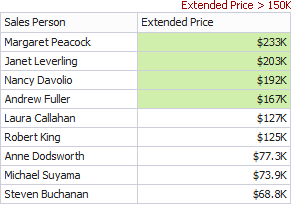 |
FormatConditionValue |
| Top-Bottom | Highlights a specific number of topmost/bottommost values. | 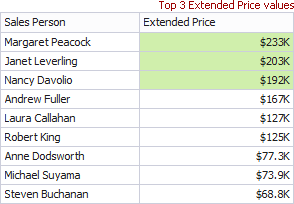 |
FormatConditionTopBottom |
| Average | Highlights values above and below an average. | 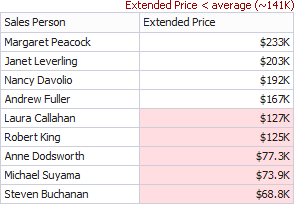 |
FormatConditionAverage |
| A Date Occurring | Allows you to highlight date-time values that fall into a specified interval relative to the current date. | 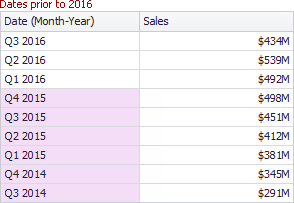 |
FormatConditionDateOccuring |
| Expression | Allows you to use complex conditions to apply formatting. You can also pass dashboard parameters to expressions. | 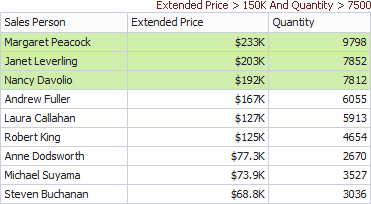 |
FormatConditionExpression |
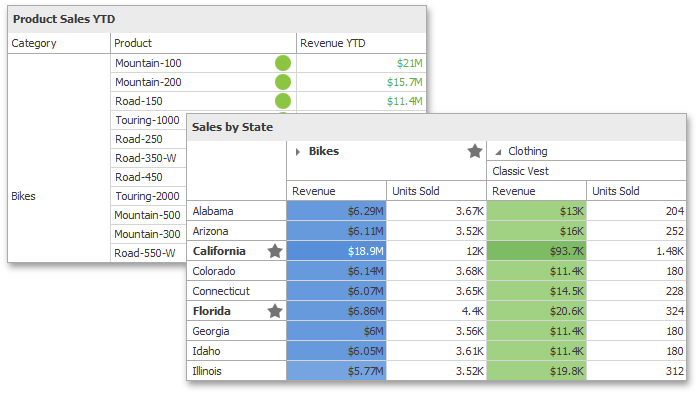
| Icon Ranges | Allows you to apply formatting by displaying specific icons for different ranges of values. You can select a predefined set of icons or use a specific icon for each range. | 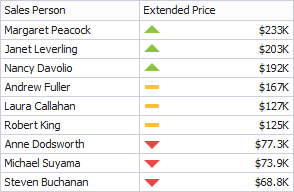 |
FormatConditionRangeSet |
| Color Ranges | Allows you to apply formatting using specific colors for different ranges of values. You can select a predefined set of colors or use custom appearance settings to highlight values within specified ranges. | 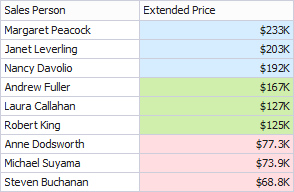 |
FormatConditionRangeSet |
| Gradient Ranges | Allows you to apply formatting using gradient color scales. | 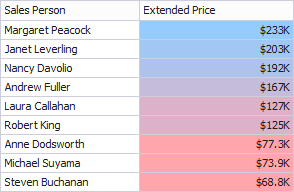 |
FormatConditionRangeGradient |
| Bar | Allows you to visualize numeric values using bars. You can also color bars corresponding to positive and negative values using different colors. | 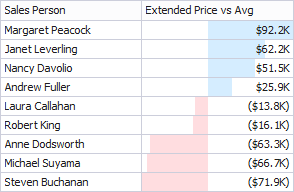 |
FormatConditionBar |
| Bar Color Ranges | Allows you to visualize numeric values using bars whose colors are contained in the specified color set. | 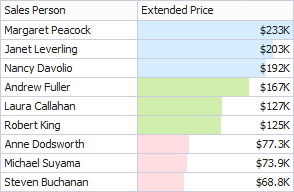 |
FormatConditionColorRangeBar |
| Bar Gradient Ranges | Allows you to visualize numeric values using bars whose colors are contained in the specified color gradient. | 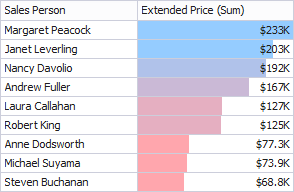 |
FormatConditionGradientRangeBar |
You can apply conditional formatting to measure or dimension values. The table below lists format conditions that can be applied to different types of data items.
Data Item | Supported Format Conditions |
|---|---|
Value Top-Bottom Average Expression Icon Ranges Color Ranges Gradient Ranges Bar Bar Color Ranges Bar Gradient Ranges | |
string Dimension | Value with the condition type set to Equal To, Not Equal To or Text that Contains Expression |
date-time Dimension | Value A Date Occurring for dimensions with the continuous date-time group interval Expression Icon Ranges Color Ranges Gradient Ranges Bar Bar Color Ranges Bar Gradient Ranges |
How to Apply Conditional Formatting
The topics below describe how to use conditional formatting in the WinForms Designer and on the web.
How to Apply Conditional Formatting in Code
Dashboard items that support conditional formatting expose the FormatRules property providing access to a collection of the DashboardItemFormatRule descendants.
To create a new rule, do the following:
- Create a required condition (the FormatConditionBase descendant), specify its settings and assign the resulting object to the DashboardItemFormatRule.Condition property.
- Use the DashboardItemFormatRule.Enabled property to specify whether the current format rule is enabled.
- Make sure that the current DashboardItemFormatRule object is properly specified using the DashboardItemFormatRule.IsValid property.
Add the created format rule to the FormatRules collection exposed by the dashboard item. See the Conditional Formatting topic for the required dashboard item for details.