Binding to Data
Both WinForms Designer and Web Dashboard allow end users to bind dashboard items to a data source in a virtually uniform manner. For instance, the WinForms Designer uses the DATA ITEMS pane to perform binding using drag-and-drop operations. At the same time, the Web Dashboard provides a pop-up menu similar to the DATA ITEMS pane.
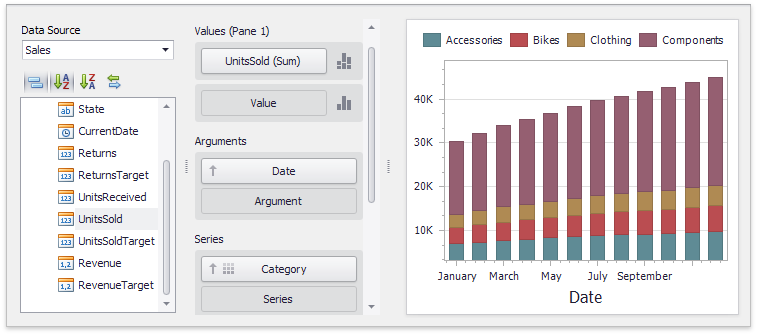
WinForms Designer
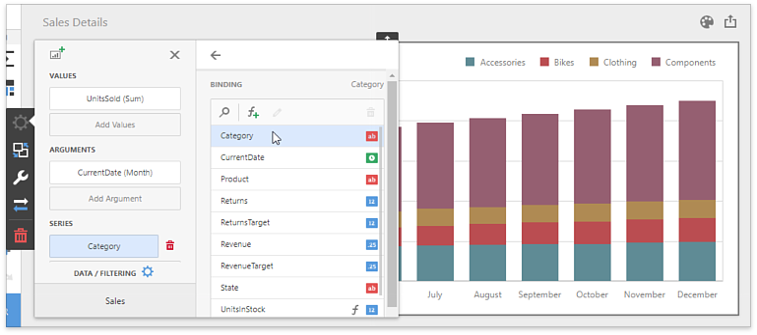
Web Dashboard
Each dashboard item type has a specific set of data sections such as Values, Arguments, and Series in the chart, Columns and Sparklines in the grid, and Values, Columns, and Rows in the pivot grid. Each data section corresponds to a particular dashboard item area or element, and should be mapped to data to be displayed within this area/element.
Measures and dimensions are used to bind a dashboard item to data source fields. They link the dashboard item to the data source fields and thus allow you to visualize grouped/summarized data within the dashboard item.
To learn how to bind dashboard items to data, see the following sections.