Grouping
- 4 minutes to read
The Dashboard allows you to group dimension values and displays summaries for entire groups rather than individual values. You can arrange dimension values in different sized groups by specifying the appropriate group interval. For instance, date-time values can be grouped by year, month, quarter, etc.
This topic describes how the Dashboard groups data by default and lists the supported text and date-time group intervals. It also explains how to change the default group intervals.
Note
Note that the Dashboard was not developed to visualize underlying, but already grouped/summarized data. You can obtain underlying data using the DashboardViewer or ASPxDashboard controls’ API. Refer to the following topics for more information:
Grouping String Values
When you add a string field to the dashboard item, the Dashboard combines identical field values into a single dimension value. You can also enable alphabetical grouping to combine field values by their first characters.
The following grouping intervals are supported for string values:
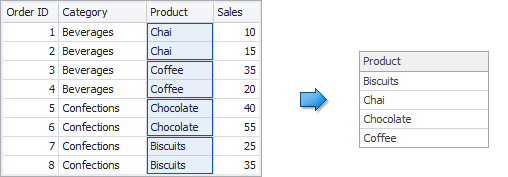
No Grouping | Each value is displayed “as is”. The Dashboard groups unique underlying string values to a single dimension value by default. In this example, the Product field is added to the dashboard item.
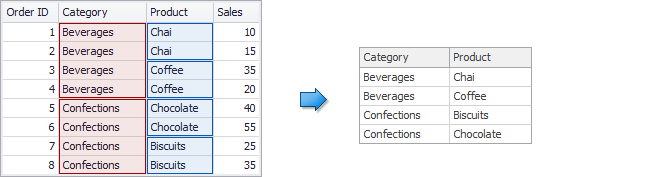
If you add several fields, the Dashboard shows unique dimension value combinations. In this example, the Category and Product fields are added.
|
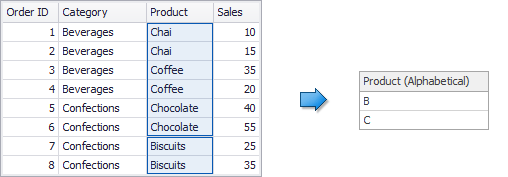
Alphabetical | Values are grouped alphabetically (for instance, A, B, C, … Z). In this example, the Product field is added to the dashboard item.
|
Grouping Date-Time Values
Grouping allows you to combine underlying date-time values into years, quarters, months, etc. Note that the Dashboard uses the Gregorian calendar for grouping date-time values.
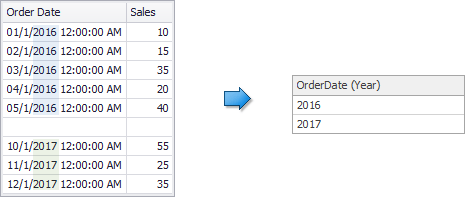
Date-time values are grouped by years by default. In this case, the Dashboard extracts a year from each date-time value and groups dates with the same year.
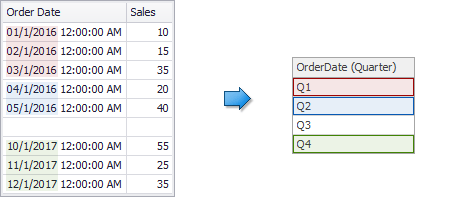
The image below shows how Dashboard groups date-time values by the same quarter in each year.
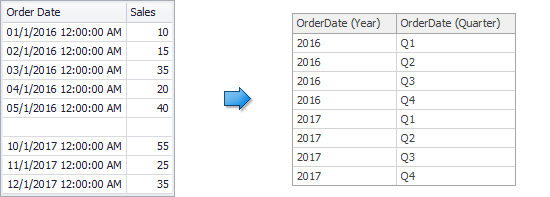
You can also add the same date-time field with different group intervals to display data hierarchically. For example, the image below shows how the Dashboard groups the Order Date field values when Year and Quarter group intervals are used.
Note that hierarchical data representation can be used with the Drill-Down feature.
The following group intervals are supported for date-time fields:
Note
Examples in the table below are formatted using the default settings. See Formatting Data to learn how to customize format settings.
| Group interval | Description | Examples |
|---|---|---|
| Year | Values are grouped by year. | 2010, 2011, 2012 |
| Quarter | Values are grouped by quarter. | Q1, Q2, Q3, Q4 |
| Month | Values are grouped by month. | January, February, March, … December |
| Day | Values are grouped by the day of the month. | 1, 2, 3, … 31 |
| Hour | Values are grouped by hour. | 0, 1, 2, … 23 |
| Minute | Values are grouped by minute. | 0, 1, 2, … 59 |
| Second | Values are grouped by second. | 0, 1, 2, … 59 |
| Day of the Year | Values are grouped by the day of the year. | 1, 2, 3, … 365 |
| Day of the Week | Values are grouped by the day of the week. | Sunday, Monday, Tuesday, … Saturday |
| Week of the Year | Values are grouped by the week of the year. | 1, 2, 3, … 52 |
| Week of the Month | Values are grouped by the week of the month. | 1, 2, 3, 4, 5 |
| Week-Year | Values are grouped by the date of the first day of the week (uses culture settings). | 7/1/2018, 7/8/2018, 7/15/2018, … 11/4/2018, 11/11/2018, 11/18/2018, … |
| Month-Year | Values are grouped by the month and year. | January 2012, February 2012, … December 2012, January 2013, … |
| Quarter-Year | Values are grouped by the year and quarter. | Q3 2012, Q4 2012, Q1 2013, Q2 2013, … |
| Day-Month-Year | Values are grouped by date. | 3/4/2012, 3/5/2012, 3/6/2012, … |
| Date-Hour | Values are grouped by date with an hour value. | 3/4/2012 0:00 AM, 3/4/2012 1:00 AM, 3/4/2012 2:00 AM, … |
| Date-Hour-Minute | Values are grouped by date with hour and minute values. | 3/4/2012 0:00 AM, 3/4/2012 0:01 AM, 3/4/2012 0:02 AM, … |
| Date-Hour-Minute-Second | Values are grouped by date with hour, minute and second values. | 3/4/2012 0:00:00 AM, 3/4/2012 0:00:01 AM, 3/4/2012 0:00:02 AM, … |
| Exact Date | Each value is displayed “as is”. | 2009, Q2 2009, 6/15/2009 1:45:30 PM, … |
How to Change Group Settings
You can change group settings in the Dashboard Designer and in code.
- See WinForms Designer - Grouping for details on how to change the group interval in the WinForms Designer.
- See Web Dashboard - Grouping for details on how to change the summary function type in the Web Dashboard.
Limitations
Note that custom grouping is not supported in OLAP mode because data in a cube is already grouped and summarized.