Providing Data
- 3 minutes to read
The Dashboard Designer allows you to bind dashboard items to data in a uniform and similar manner. See the Bind Dashboard Items to Data topic for common information.
The difference is in the data sections that the specific dashboard item has. This topic describes how to bind the Scatter Chart dashboard item to data in the Designer or in code.
Binding to Data in the Designer
The image below shows a sample Scatter Chart dashboard item that is bound to data.
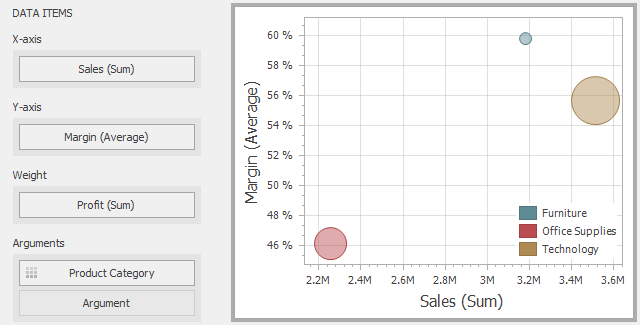
To bind the Scatter Chart dashboard item to data, drag and drop a data source field to a placeholder contained in one of the available data sections. A table below lists and describes Scatter Chart data sections.
| Section | Processed as | Description |
|---|---|---|
| X-Axis | Measure | Contains the data item against which the X-coordinates of data points are calculated. |
| Y-Axis | Measure | Contains the data item against which the Y-coordinates of data points are calculated. |
| Weight | Measure | Contains the data item whose values are used to calculate the weight of data points. |
| Arguments | Dimension | Contains data items providing scatter chart arguments that are used to create data points. |
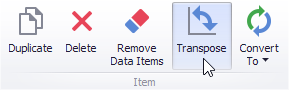
Transposing X- and Y-axis
The Scatter Chart dashboard item provides the capability to transpose its axes. In this case, the data item contained in the X-Axis section is moved to the Y-Axis section, and vice versa.

To transpose the selected Scatter Chart dashboard item, use the Transpose button in the Home ribbon tab.
Binding to Data in Code
To provide data for the Scatter Chart dashboard item in code, create the ScatterChartDashboardItem object and specify the following properties.
X-axis | |
Y-Axis | |
Weight | |
Arguments |
Example
The following code snippet shows how to bind a Scatter Chart dashboard item to data in code.
using System;
using DevExpress.DashboardCommon;

namespace Dashboard_CreateScatterChart {
    public partial class Form1 : DevExpress.XtraEditors.XtraForm {
        public Form1() {
            InitializeComponent();
        }

        private void Form1_Load(object sender, EventArgs e) {
            Dashboard dashboard = new Dashboard();

            // Create an OLAP dashboard data source with the connection string
            // stored in the app.config file.
            DashboardOlapDataSource olapDataSource = new DashboardOlapDataSource();
            olapDataSource.ConnectionName = "AdventureWorksString";
            dashboard.DataSources.Add(olapDataSource);

            // Create a scatter chart and binds it to data.
            ScatterChartDashboardItem scatterChart = new ScatterChartDashboardItem();
            scatterChart.DataSource = olapDataSource;
            scatterChart.AxisXMeasure = new Measure("[Measures].[Sales Amount]");
            scatterChart.AxisYMeasure = new Measure("[Measures].[Gross Profit Margin]");
            scatterChart.Arguments.Add(new Dimension("[Product].[Category].[Category]"));
            scatterChart.Weight = new Measure("[Measures].[Gross Profit]");

            // Add the scatter chart to the dashboard and
            // display the dashboard in the Dashboard Viewer.
            dashboard.Items.Add(scatterChart);
            dashboardViewer1.Dashboard = dashboard;
        }
    }
}