Conditional Formatting
- 6 minutes to read
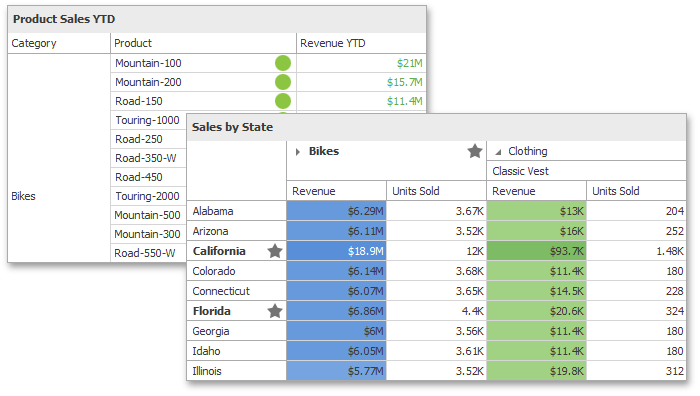
The Dashboard Designer provides you with the capability to apply formatting to dashboard item elements whose values meet a specified condition. This feature allows you to highlight specific elements using a predefined set of rules.
To learn more about the specifics of using a conditional formatting feature for different dashboard items, see the following topics.
The topic describes the following common concepts:
- Conditional Formatting Overview
- Create a Format Rule
- Specify Appearance Settings
- Edit a Format Rule
- Create a Format Rule in Code
Conditional Formatting Overview
Format rules used in conditional formatting can be divided into groups depending on their purpose and can be applied to measure or dimension values.
Format Rule | Description |
|---|---|
Allows you to compare static values (such as Greater Than, Less Than, Between, etc.). | |
Highlights a specific number of topmost/bottommost values. | |
Highlights values above and below an average. | |
Allows you to highlight date-time values that fall into a specified interval. | |
Allows you to use complex conditions to apply formatting. You can also pass dashboard parameters to expressions. | |
Allows you to apply formatting by displaying specific icons for different ranges of values. You can select a predefined set of icons or use a specific icon for each range. | |
Allows you to apply formatting using specific colors for different ranges of values. You can select a predefined set of colors or use custom appearance settings to highlight values within specified ranges. | |
Allows you to apply formatting using gradient color scales. | |
Allows you to visualize numeric values using bars. You can also color bars corresponding to positive and negative values using different colors. | |
Allows you to visualize numeric values using bars whose colors are contained in the specified color set. | |
Allows you to visualize numeric values using bars whose colors are contained in the specified color gradient. |
You can apply conditional formatting to measure or dimension values. The table below lists format conditions that can be applied to different types of data items.
Data Item | Supported Format Conditions |
|---|---|
string Dimension | Value with the condition type set to Equal To, Not Equal To or Text that Contains |
date-time Dimension |
A Date Occurring for dimensions with the continuous date-time group interval |
Create a Format Rule
To create a new rule used to apply formatting according to the required condition, do the following.
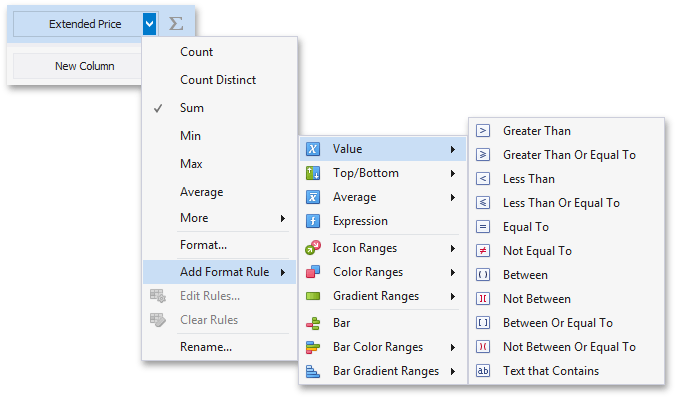
Choose a measure/dimension by whose values a format condition will be calculated. Click the measure/dimension menu button, select Add Format Rule and choose the condition.
This invokes the dialog that depends on the selected format condition and the type of the dashboard item. For instance, the image below displays the Greater Than dialog corresponding to the Value format condition for the Grid dashboard item.
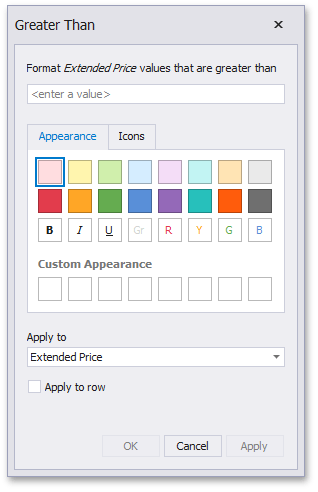
In this dialog, specify settings specific for the selected condition (for instance, specify a value to compare with dimension/measure values). To learn more, see the documentation for the required condition.
- Specify appearance settings applied to elements whose values meet the specified condition.
Specify the data item and its values to which conditional formatting is applied using the Apply to combo box. Thus, you can create a format rule for one data item and apply new appearance settings to the other data item. You can also create format rules for hidden measures and apply formatting to values of visible data items.
Note
Different dashboard items can provide additional capabilities for creating a new format rule. To learn more, refer to documentation for the required dashboard item.
Specify Appearance Settings
When creating a new format rule, you can select the required appearance settings applied according to the current format condition. All format conditions allow you to customize appearance settings in a similar manner. For instance, the Value format condition allows you to specify appearance settings in the following way.
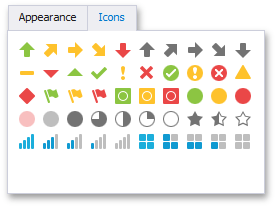
The Appearance tab allows you to choose the predefined background color/font.
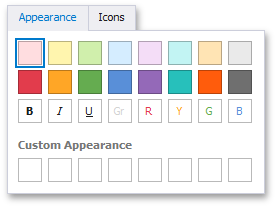
The Icons tab allows you to add the predefined icon.
Use the Custom Appearance area in the Appearance tab to add presets containing custom appearance settings. To add a new preset, click an empty square. This invokes the Custom Style Settings dialog, allowing you to specify the required appearance settings.

In this dialog, you can specify the background/foreground colors and font settings. Click Create to add a preset. The created preset will be displayed in the Custom Appearance area.
Edit a Format Rule
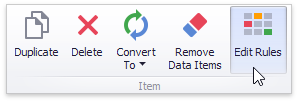
To edit format rules for the selected dashboard item, click the Edit Rules button in the Home ribbon tab.
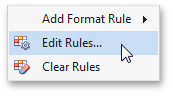
As an alternative, use the Edit Rules data item’s menu item or the corresponding item in the dashboard item’s context menu.
This invokes the Edit Rules dialog containing existing format rules for this dashboard item.
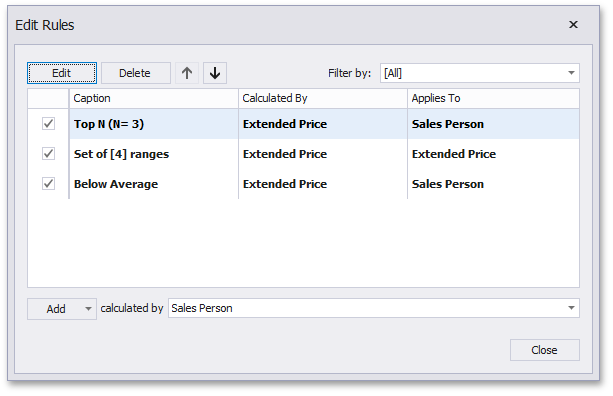
This dialog allows you to perform the following actions.
- To edit the selected rule, use the Edit button or double-click the required rule.
- To delete the selected rule, use the Delete button.
- To reorder format rules, use the Up and Down buttons (the
 and
and  icon, respectively). Reordering of rules allows you to specify the priority of rules from higher (a bottommost rule) to lower (a topmost rule).
 - To enable/disable the required rule, use the corresponding check box on the left column.
- To create a new rule, click the Add button and select the required format condition. The calculated by combo box allows you to select the measure/dimension by whose values a format rule is applied.
- To filter format rules by the specified data item, use the Filter by combo box.
To clear all rules for the specified data item, use the Clear Rules button in the data item’s context menu.
Create a Format Rule in Code
Dashboard items that support conditional formatting expose the FormatRules property providing access to a collection of the DashboardItemFormatRule descendants.
To create a new rule, do the following.
- Create a required condition (the FormatConditionBase descendant), specify its settings and assign the resulting object to the DashboardItemFormatRule.Condition property.
- Use the DashboardItemFormatRule.Enabled property to specify whether the current format rule is enabled.
- Make sure that the current DashboardItemFormatRule object is properly specified using the DashboardItemFormatRule.IsValid property.
Finally, add the created format rule to the FormatRules collection exposed by the dashboard item. To learn more, see the Conditional Formatting topic for the required dashboard item.