XYDiagramSeriesViewBase.Pane Property
Namespace: DevExpress.XtraCharts
Assembly: DevExpress.XtraCharts.v19.1.dll
Declaration
[NonTestableProperty]
[XtraSerializableProperty(XtraSerializationVisibility.Hidden)]
[XtraChartsLocalizableCategory(XtraChartsCategory.Layout)]
public XYDiagramPaneBase Pane { get; set; }Property Value
| Type | Description |
|---|---|
| XYDiagramPaneBase | An XYDiagramDefaultPane or an XYDiagramPane object, representing the pane for the current series. |
Remarks
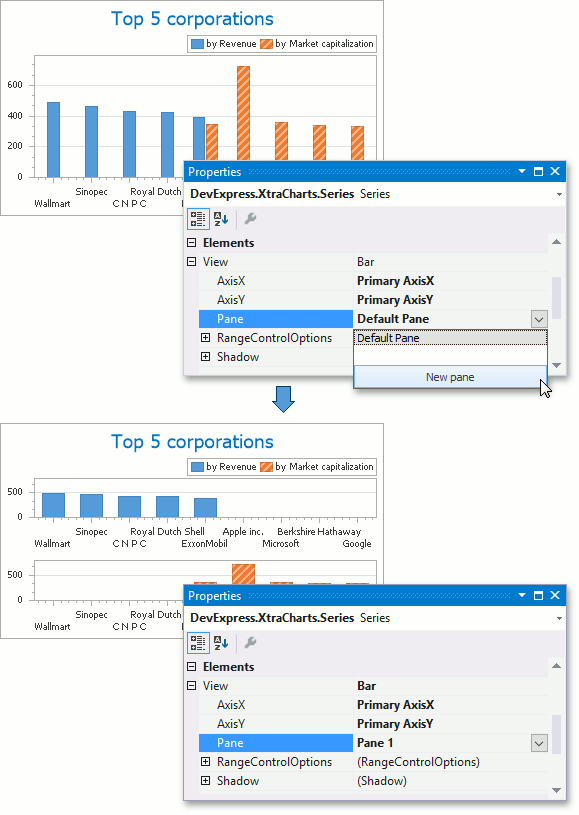
By default, an XY-diagram displays a single default pane, which is accessible via the XYDiagram2D.DefaultPane property. If a diagram contains several series, it is possible to display each series on a separate pane. To do this, add an XYDiagramPane object to the XYDiagram2D.Panes collection (by default it is empty) and set the Pane property to this pane.
For more information, refer to Panes.
Example
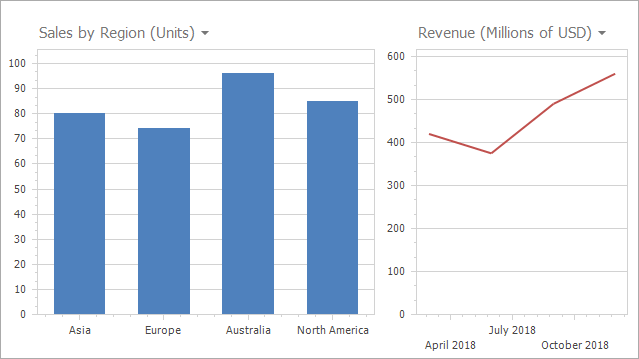
This example shows how to plot multiple series in separate panes.
Create a ChartControl object.
Create two Series objects. Populate their Points collection with SeriesPoint objects. Add both series to the ChartControl.Series collection. See the Providing Data document for more information on how to create series and populate them with data.
To add a pane in addition to the diagram’s DefaultPane, create a new XYDiagramPane and add it to the Panes collection. Use the
XYDiagramSeriesViewBase.Paneproperty to assign the pane to a series view.Use the following API to specify the pane title and position options:
Member Description XYDiagramPaneBase.Title Returns the pane title settings. XYDiagram2D.PaneDistance Specifies the distance between a diagram’s panes. XYDiagram2D.PaneLayout Returns the diagram’s pane layout configuration. XYDiagramPaneBase.LayoutOptions Returns settings that configure the pane’s position in the Grid Layout. To add a secondary x-axis, add a SecondaryAxisX object to the diagram’s SecondaryAxesX collection. To add a secondary y-axis, add a SecondaryAxisY object to the diagram’s SecondaryAxesY collection. To assign the axes to the view, use the AxisX and AxisY properties.
Use the following properties to customize the axis options:
Member Description Axis2D.Alignment Specifies the position of an axis relative to another primary axis. AxisBase.GridLines Gets the grid lines settings.
using System;
using System.Windows.Forms;
using DevExpress.Utils;
using DevExpress.XtraCharts;
// ...
private void OnFormLoad(object sender, EventArgs e) {
    // Create a new chart.
    ChartControl chartControl1 = new ChartControl();

    // Create two series.
    Series series1 = new Series("Series 1", ViewType.Bar);
    Series series2 = new Series("Series 2", ViewType.Line);

    // Add points to them, with their arguments different.
    series1.Points.Add(new SeriesPoint("Asia", 80));
    series1.Points.Add(new SeriesPoint("Europe", 74));
    series1.Points.Add(new SeriesPoint("Australia", 96));
    series1.Points.Add(new SeriesPoint("North America", 85));

    series2.Points.Add(new SeriesPoint(new DateTime(2018, 02, 28), 420));
    series2.Points.Add(new SeriesPoint(new DateTime(2018, 05, 31), 375));
    series2.Points.Add(new SeriesPoint(new DateTime(2018, 08, 31), 490));
    series2.Points.Add(new SeriesPoint(new DateTime(2018, 11, 30), 560));

    // Add both series to the chart.
    chartControl1.Series.AddRange(new Series[] { series1, series2 });

    // Cast the second series's view to the LineSeriesView type.
    LineSeriesView myView = (LineSeriesView)series2.View;

    // Hide the legend (optional).
    chartControl1.Legend.Visibility = DefaultBoolean.False;

    // Cast the chart's diagram to the XYDiagram type,
    // to access its axes and panes.
    XYDiagram diagram = (XYDiagram)chartControl1.Diagram;

    // Add a new additional pane to the diagram.
    diagram.Panes.Add(new XYDiagramPane("My Pane"));

    // Note that the created pane has the zero index in the collection,
    // because the existing Default pane is a separate entity.
    myView.Pane = diagram.Panes[0];

    // Add titles to panes.
    diagram.DefaultPane.Title.Text = "Sales by Region (Units)";
    diagram.DefaultPane.Title.Visibility = DefaultBoolean.True;
    diagram.Panes[0].Title.Text = "Revenue (Millions of USD)";
    diagram.Panes[0].Title.Visibility = DefaultBoolean.True;

    // Customize the pane layout.
    diagram.PaneDistance = 10;
    diagram.PaneLayout.AutoLayoutMode = PaneAutoLayoutMode.Linear;
    diagram.PaneLayout.Direction = PaneLayoutDirection.Horizontal;
    diagram.DefaultPane.LayoutOptions.ColumnSpan = 3;
    diagram.Panes[0].LayoutOptions.ColumnSpan = 2;

    // Add secondary axes to the diagram, and adjust their options.
    diagram.SecondaryAxesX.Add(new SecondaryAxisX("My Axis X"));
    diagram.SecondaryAxesY.Add(new SecondaryAxisY("My Axis Y"));
    diagram.SecondaryAxesX[0].Alignment = AxisAlignment.Near;
    diagram.SecondaryAxesY[0].Alignment = AxisAlignment.Near;
    diagram.SecondaryAxesY[0].GridLines.Visible = true;

    // Assign both the additional pane and, if required,
    // the secondary axes to the second series.
    myView.AxisX = diagram.SecondaryAxesX[0];
    myView.AxisY = diagram.SecondaryAxesY[0];

    // Add the chart to the form.
    chartControl1.Dock = DockStyle.Fill;
    this.Controls.Add(chartControl1);
}
Related GitHub Examples
The following code snippet (auto-collected from DevExpress Examples) contains a reference to the Pane property.
Note
The algorithm used to collect these code examples remains a work in progress. Accordingly, the links and snippets below may produce inaccurate results. If you encounter an issue with code examples below, please use the feedback form on this page to report the issue.