XYDiagramPaneBase.EnableAxisYScrolling Property
Namespace: DevExpress.XtraCharts
Assembly: DevExpress.XtraCharts.v18.2.dll
Declaration
[XtraChartsLocalizableCategory(XtraChartsCategory.Behavior)]
[XtraSerializableProperty]
public DefaultBoolean EnableAxisYScrolling { get; set; }Property Value
| Type | Description |
|---|---|
| DefaultBoolean | A DefaultBoolean value, which represents the availability of Y-axis scrolling. |
Available values:
| Name | Description |
|---|---|
| True | Corresponds to a Boolean value of true. |
| False | Corresponds to a Boolean value of false. |
| Default | The value is determined by the current object’s parent object setting (e.g., a control setting). |
Remarks
Use the EnableAxisYScrolling property to specify whether it’s allowed to scroll an individual pane along its Y-axis.
Important
The EnableAxisYScrolling property affects on the pane’s scrolling capability only on the WinForms platform. The ASP.NET WebForms Chart Control and MVC Chart Extension do not support this feature.
When the EnableAxisYScrolling property is set to Default, the actual scrolling status is determined by the XYDiagram2D.EnableAxisYScrolling property value.
At runtime, you can get the actual status of a pane’s Y-axis scrolling, via the read-only XYDiagramPaneBase.ActualEnableAxisYScrolling property.
For more information, refer to Zooming and Scrolling (2D XY-Charts).
Example
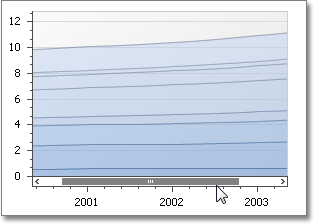
This example demonstrates how you can individually adjust scrolling along the required axes. A chart with two panes is used to demonstrate this feature.
In this example, a chart with two series is created. The second series is assigned to an additional pane.
In addition, to show scrolling bars along axes, the axis whole range and axis visible range is specified and the ScrollingOptions2D.UseScrollBars property is set to true. To learn more on axis ranges, refer to Visual Ranges and Whole Ranges .
To specify scrolling along the axes of the diagram’s panes, the XYDiagram2D.EnableAxisXScrolling and XYDiagram2D.EnableAxisYScrolling properties are used.
For more information, refer to Zooming and Scrolling (2D XY-Charts).
Note
A complete sample project is available at https://github.com/DevExpress-Examples/how-to-individually-adjust-scrolling-along-the-axes-t218691
using DevExpress.Utils;
using DevExpress.XtraCharts;
using System;
using System.Windows.Forms;

namespace WindowsFormsApplication2 {
    public partial class Form1 : Form {
        public Form1() {
            InitializeComponent();
        }

        private void Form1_Load(object sender, EventArgs e) {
            // Create a new Chart control and add it to the form.
            ChartControl chart = new ChartControl();
            chart.Dock = DockStyle.Fill;
            this.Controls.AddRange(new Control[] { chart });

            // Create a Bar series and add points to it.
            Series series1 = new Series("Bar", ViewType.Bar);
            series1.Points.Add(new SeriesPoint("A", new double[] { 10 }));
            series1.Points.Add(new SeriesPoint("B", new double[] { 32 }));
            series1.Points.Add(new SeriesPoint("C", new double[] { 44 }));
            series1.Points.Add(new SeriesPoint("D", new double[] { 67 }));

            // Create a Line series and add points to it.
            Series series2 = new Series("Line", ViewType.Line);
            series2.Points.Add(new SeriesPoint("A", new double[] { 15 }));
            series2.Points.Add(new SeriesPoint("B", new double[] { 18 }));
            series2.Points.Add(new SeriesPoint("C", new double[] { 21 }));
            series2.Points.Add(new SeriesPoint("D", new double[] { 27 }));

            // Add the series to the chart.
            chart.Series.Add(series1);
            chart.Series.Add(series2);

            // Cast the chart's diagram to the XYDiagram type, to access its axes.
            XYDiagram diagram = (XYDiagram)chart.Diagram;

            // Add a new additional pane to the diagram.
            diagram.Panes.Add(new XYDiagramPane("My Pane"));

            // Assign the additional pane  to the second series.
            // Note that the created pane has the zero index in the collection,
            // because the existing Default pane is a separate entity.
            LineSeriesView myView = (LineSeriesView)series2.View;
            myView.Pane = diagram.Panes[0];

            // Define the whole range for the axes.
            diagram.AxisX.WholeRange.Auto = false;
            diagram.AxisX.WholeRange.SetMinMaxValues("A", "D");
            diagram.AxisY.WholeRange.Auto = false;
            diagram.AxisY.WholeRange.SetMinMaxValues(0, 70);

            // Define the visible range for the axes.
            diagram.AxisX.VisualRange.Auto = false;
            diagram.AxisX.VisualRange.SetMinMaxValues("B", "C");
            diagram.AxisY.VisualRange.Auto = false;
            diagram.AxisY.VisualRange.SetMinMaxValues(7, 50);

            // Specify the axes scrolling at the diagram's level.
            diagram.EnableAxisXScrolling = true;
            diagram.EnableAxisYScrolling = false;

            // Individually specify the axes scrolling for the panes.
            diagram.DefaultPane.EnableAxisXScrolling = DefaultBoolean.Default;
            diagram.Panes[0].EnableAxisXScrolling = DefaultBoolean.False;
            diagram.Panes[0].EnableAxisYScrolling = DefaultBoolean.True;

            // Adjust how the scrolling can be performed.
            diagram.ScrollingOptions.UseKeyboard = false;
            diagram.ScrollingOptions.UseMouse = false;
            diagram.ScrollingOptions.UseScrollBars = true;
        }
    }
}