XYDiagram2D.EnableAxisXScrolling Property
Namespace: DevExpress.XtraCharts
Assembly: DevExpress.XtraCharts.v20.2.dll
NuGet Packages: DevExpress.Charts, DevExpress.WindowsDesktop.Charts
Declaration
[XtraChartsLocalizableCategory(XtraChartsCategory.Behavior)]
public bool EnableAxisXScrolling { get; set; }Property Value
| Type | Description |
|---|---|
| Boolean | true to allow X-axis scrolling; otherwise, false. |
Remarks
Use the EnableAxisXScrolling property to specify whether it’s allowed to scroll the diagram‘s panes along their X-axis, both at design and runtime.
Important
The EnableAxisXScrolling property affects on the diagram’s scrolling capability only on the WinForms platform. The ASP.NET WebForms Chart Control and MVC Chart Extension do not support this feature.
When the EnableAxisXScrolling property is set to true and the automatic axis range detection is switched off (the Range.Auto property is disabled), you can specify the range through which each axis can be scrolled (via the AxisBase.WholeRange property). For details on this, refer to Visual Ranges and Whole Ranges .
After you’ve specified the EnableAxisXScrolling property, you can individually adjust the capability to scroll the X-axis of each pane via its XYDiagramPaneBase.EnableAxisXScrolling property. And, the default value of the XYDiagramPaneBase.EnableAxisXScrolling property means that the actual setting for this pane is obtained from the EnableAxisXScrolling property.
At runtime, you can get the actual status of a pane’s X-axis scrolling via the read-only XYDiagramPaneBase.ActualEnableAxisXScrolling property.
Note
When the EnableAxisXScrolling property is enabled, the XYDiagram2D.ScrollingOptions property becomes available, which allows you to choose ways in which scrolling can be performed (via the mouse, keyboard, using flick gestures on your touchscreen device or using the scroll bars).
For the Y-axes, the similar XYDiagram2D.EnableAxisYScrolling property is available.
To enable zooming along the X-axis of the diagram’s panes, use the XYDiagram2D.EnableAxisXZooming property.
For more information, refer to Zooming and Scrolling (2D XY-Charts).
Example
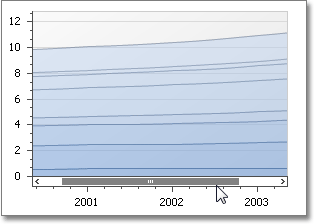
This example demonstrates how you can individually adjust scrolling along the required axes. A chart with two panes is used to demonstrate this feature.
In this example, a chart with two series is created. The second series is assigned to an additional pane.
In addition, to show scrolling bars along axes, the axis whole range and axis visible range is specified and the ScrollingOptions2D.UseScrollBars property is set to true. To learn more on axis ranges, refer to Visual Ranges and Whole Ranges .
To specify scrolling along the axes of the diagram’s panes, the XYDiagram2D.EnableAxisXScrolling and XYDiagram2D.EnableAxisYScrolling properties are used.
For more information, refer to Zooming and Scrolling (2D XY-Charts).
Note
A complete sample project is available at https://github.com/DevExpress-Examples/how-to-individually-adjust-scrolling-along-the-axes-t218691
using DevExpress.Utils;
using DevExpress.XtraCharts;
using System;
using System.Windows.Forms;

namespace WindowsFormsApplication2 {
    public partial class Form1 : Form {
        public Form1() {
            InitializeComponent();
        }

        private void Form1_Load(object sender, EventArgs e) {
            // Create a new Chart control and add it to the form.
            ChartControl chart = new ChartControl();
            chart.Dock = DockStyle.Fill;
            this.Controls.AddRange(new Control[] { chart });

            // Create a Bar series and add points to it.
            Series series1 = new Series("Bar", ViewType.Bar);
            series1.Points.Add(new SeriesPoint("A", new double[] { 10 }));
            series1.Points.Add(new SeriesPoint("B", new double[] { 32 }));
            series1.Points.Add(new SeriesPoint("C", new double[] { 44 }));
            series1.Points.Add(new SeriesPoint("D", new double[] { 67 }));

            // Create a Line series and add points to it.
            Series series2 = new Series("Line", ViewType.Line);
            series2.Points.Add(new SeriesPoint("A", new double[] { 15 }));
            series2.Points.Add(new SeriesPoint("B", new double[] { 18 }));
            series2.Points.Add(new SeriesPoint("C", new double[] { 21 }));
            series2.Points.Add(new SeriesPoint("D", new double[] { 27 }));

            // Add the series to the chart.
            chart.Series.Add(series1);
            chart.Series.Add(series2);

            // Cast the chart's diagram to the XYDiagram type, to access its axes.
            XYDiagram diagram = (XYDiagram)chart.Diagram;

            // Add a new additional pane to the diagram.
            diagram.Panes.Add(new XYDiagramPane("My Pane"));

            // Assign the additional pane  to the second series.
            // Note that the created pane has the zero index in the collection,
            // because the existing Default pane is a separate entity.
            LineSeriesView myView = (LineSeriesView)series2.View;
            myView.Pane = diagram.Panes[0];

            // Define the whole range for the axes.
            diagram.AxisX.WholeRange.Auto = false;
            diagram.AxisX.WholeRange.SetMinMaxValues("A", "D");
            diagram.AxisY.WholeRange.Auto = false;
            diagram.AxisY.WholeRange.SetMinMaxValues(0, 70);

            // Define the visible range for the axes.
            diagram.AxisX.VisualRange.Auto = false;
            diagram.AxisX.VisualRange.SetMinMaxValues("B", "C");
            diagram.AxisY.VisualRange.Auto = false;
            diagram.AxisY.VisualRange.SetMinMaxValues(7, 50);

            // Specify the axes scrolling at the diagram's level.
            diagram.EnableAxisXScrolling = true;
            diagram.EnableAxisYScrolling = false;

            // Individually specify the axes scrolling for the panes.
            diagram.DefaultPane.EnableAxisXScrolling = DefaultBoolean.Default;
            diagram.Panes[0].EnableAxisXScrolling = DefaultBoolean.False;
            diagram.Panes[0].EnableAxisYScrolling = DefaultBoolean.True;

            // Adjust how the scrolling can be performed.
            diagram.ScrollingOptions.UseKeyboard = false;
            diagram.ScrollingOptions.UseMouse = false;
            diagram.ScrollingOptions.UseScrollBars = true;
        }
    }
}
Related GitHub Examples
The following code snippets (auto-collected from DevExpress Examples) contain references to the EnableAxisXScrolling property.
Note
The algorithm used to collect these code examples remains a work in progress. Accordingly, the links and snippets below may produce inaccurate results. If you encounter an issue with code examples below, please use the feedback form on this page to report the issue.