WaterfallSeriesView Class
The Waterfall series view.
Namespace: DevExpress.XtraCharts
Assembly: DevExpress.XtraCharts.v19.2.dll
Declaration
Remarks
The following image shows a waterfall chart and its element:
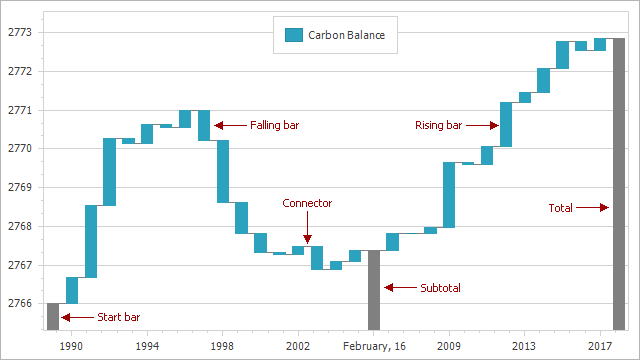
A data source for a waterfall chart can store relative and absolute data values.
For a chart with relative data, you can add a start bar with a given value and label. To do this, cast the ValueOptions property to WaterfallRelativeValueOptions. Then, specify the WaterfallRelativeValueOptions.StartBarValue and WaterfallRelativeValueOptions.StartBarLabel properties.
If the data source stores absolute data values, cast the ValueOptions property to the WaterfallAbsoluteValueOptions type.
The Waterfall chart displays a Total bar. To change its label, use the WaterfallValueOptionsBase.TotalLabel property. To hide the total bar, set WaterfallValueOptionsBase.ShowTotal to false.
You can add a sets of subtotals. To do this, populate the WaterfallValueOptionsBase.Subtotals collection with Subtotal objects.
Use the following properties to change the appearance of waterfall chart elements:
- ConnectorColor
- ConnectorStyle
- FallingBarColor
- RisingBarColor
- StartBarColor
- SubtotalBarColor
- TotalBarColor
Example
This example shows how to create a chart with a data series of the waterfall view.
- Add a series to a chart.
- Specify the series data members.
- Use the
WaterfallSeriesViewobject to configure the series view options. Specify value options. If data source stores value differences, use the WaterfallRelativeValueOptions. Use the WaterfallAbsoluteValueOptions class if the data source stores absolute data values.
private void Form1_Load(object sender, EventArgs e) {
    chartControl1.DataSource = LoadDataTableFromXml("../../Data/carbon.xml", "CarbonContribution");
    Series series = new Series("Carbon Balance", ViewType.Waterfall);
    series.SetDataMembers("Year", "Contribution");
    series.ArgumentScaleType = ScaleType.Qualitative;
    chartControl1.Series.Add(series);
    ((WaterfallSeriesLabel)series.Label).Position = WaterfallSeriesLabelPosition.OutsideEnd;
    series.LabelsVisibility = DevExpress.Utils.DefaultBoolean.True;
    WaterfallSeriesView view = series.View as WaterfallSeriesView;
    if (view != null) {
        view.RisingBarColor = Color.FromArgb(218, 88, 89);
        view.FallingBarColor = Color.FromArgb(146, 206, 181);
        view.SubtotalBarColor = Color.Gray;
        view.TotalBarColor = Color.DarkGray;
        view.StartBarColor = Color.LightGray;
        view.ConnectorColor = Color.Black;
        view.ConnectorStyle.Thickness = 1;
        WaterfallRelativeValueOptions valueOptions = view.ValueOptions as WaterfallRelativeValueOptions;
        if (valueOptions != null) {
            valueOptions.StartBarLabel = "1989";
            valueOptions.StartBarValue = 2766D;
            valueOptions.ShowTotal = true;
            valueOptions.TotalLabel = "2018";
            valueOptions.Subtotals.Add(new Subtotal { PointIndex = 16, Label= "February 16, 2005" });
        }
    }
}