WaterfallSeriesLabelPosition Enum
Namespace: DevExpress.XtraCharts
Assembly: DevExpress.XtraCharts.v19.2.dll
Declaration
[ResourceFinder(typeof(XtraChartsResFinder), "PropertyNamesRes")]
public enum WaterfallSeriesLabelPositionMembers
| Name | Description |
|---|---|
Auto
|
The label position is defined based on the series count. Labels are outside waterfall bars if the chart shows a single waterfall series. Labels are positioned in the bar center if the chart shows multiple waterfall series. |
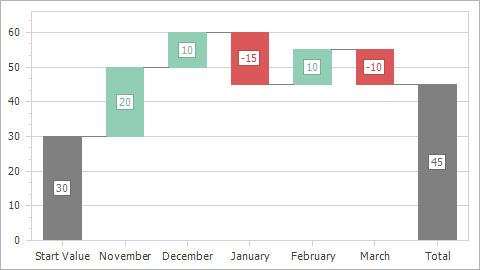
Center
|
Labels are displayed in the center of waterfall bars.
|
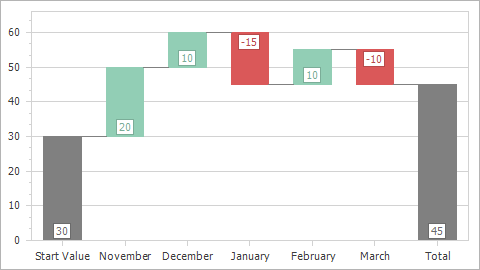
InsideEnd
|
Labels are displayed inside waterfall bars, at the bottom of falling bars and at the top of rising bars.
|
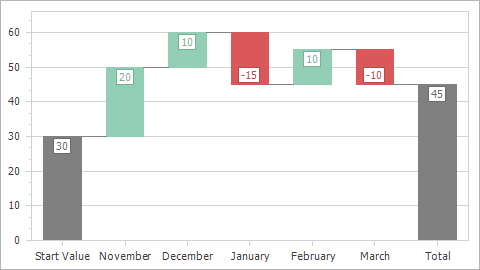
InsideStart
|
Labels are displayed inside waterfall bars, at the bottom of rising bars and at the top of falling bars.
|
Related API Members
The following properties accept/return WaterfallSeriesLabelPosition values:
Remarks
Use the WaterfallSeriesLabelPosition enumeration values to set the WaterfallSeriesLabel.Position property.
Example
This example shows how to create a chart with a data series of the waterfall view.
- Add a series to a chart.
- Specify the series data members.
- Use the WaterfallSeriesView object to configure the series view options.
Specify value options. If data source stores value differences, use the WaterfallRelativeValueOptions. Use the WaterfallAbsoluteValueOptions class if the data source stores absolute data values.
private void Form1_Load(object sender, EventArgs e) {
    chartControl1.DataSource = LoadDataTableFromXml("../../Data/carbon.xml", "CarbonContribution");
    Series series = new Series("Carbon Balance", ViewType.Waterfall);
    series.SetDataMembers("Year", "Contribution");
    series.ArgumentScaleType = ScaleType.Qualitative;
    chartControl1.Series.Add(series);
    ((WaterfallSeriesLabel)series.Label).Position = WaterfallSeriesLabelPosition.OutsideEnd;
    series.LabelsVisibility = DevExpress.Utils.DefaultBoolean.True;
    WaterfallSeriesView view = series.View as WaterfallSeriesView;
    if (view != null) {
        view.RisingBarColor = Color.FromArgb(218, 88, 89);
        view.FallingBarColor = Color.FromArgb(146, 206, 181);
        view.SubtotalBarColor = Color.Gray;
        view.TotalBarColor = Color.DarkGray;
        view.StartBarColor = Color.LightGray;
        view.ConnectorColor = Color.Black;
        view.ConnectorStyle.Thickness = 1;
        WaterfallRelativeValueOptions valueOptions = view.ValueOptions as WaterfallRelativeValueOptions;
        if (valueOptions != null) {
            valueOptions.StartBarLabel = "1989";
            valueOptions.StartBarValue = 2766D;
            valueOptions.ShowTotal = true;
            valueOptions.TotalLabel = "2018";
            valueOptions.Subtotals.Add(new Subtotal { PointIndex = 16, Label= "February 16, 2005" });
        }
    }
}