TaskLinkOptions.ArrowHeight Property
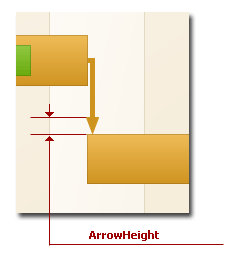
Gets or sets the arrowhead length in pixels.
Namespace: DevExpress.XtraCharts
Assembly: DevExpress.XtraCharts.v23.2.dll
NuGet Package: DevExpress.Charts
Declaration
Property Value
| Type | Description |
|---|---|
| Int32 | An integer value that specifies the length of the arrowhead (in pixels). The default value is 5. |
Property Paths
You can access this nested property as listed below:
| Object Type | Path to ArrowHeight |
|---|---|
| GanttDrawOptions |
|
| GanttSeriesView |
|
Remarks
You can also specify the arrowhead width using the TaskLinkOptions.ArrowWidth property.
Example
The following example demonstrates how to create a ChartControl with two series of the OverlappedGanttSeriesView type, and add this chart to a form at runtime. Before proceeding with this example, first create a Windows Forms Application in Visual Studio, and include all necessary assemblies to the References list of your project.
Then, add the following code to the Form.Load event handler.
using System;
using System.Windows.Forms;
using DevExpress.XtraCharts;
// ...
private void Form1_Load(object sender, EventArgs e) {
// Create a new chart.
ChartControl overlappedGanttChart = new ChartControl();
// Create two Gantt series.
Series series1 = new Series("Planned", ViewType.Gantt);
Series series2 = new Series("Completed", ViewType.Gantt);
// Set the date-time values scale type for both series,
// as it is qualitative, by default.
series1.ValueScaleType = ScaleType.DateTime;
series2.ValueScaleType = ScaleType.DateTime;
// Add points to them.
series1.Points.Add(new SeriesPoint("Market analysis", new DateTime[] {
new DateTime(2006, 8, 16), new DateTime(2006, 8, 23) }));
series1.Points.Add(new SeriesPoint("Feature planning", new DateTime[] {
new DateTime(2006, 8, 23), new DateTime(2006, 8, 26) }));
series1.Points.Add(new SeriesPoint("Implementation", new DateTime[] {
new DateTime(2006, 8, 26), new DateTime(2006, 9, 26) }));
series1.Points.Add(new SeriesPoint("Testing & bug fixing", new DateTime[] {
new DateTime(2006, 9, 26), new DateTime(2006, 10, 10) }));
series2.Points.Add(new SeriesPoint("Market analysis", new DateTime[] {
new DateTime(2006, 8, 16), new DateTime(2006, 8, 23) }));
series2.Points.Add(new SeriesPoint("Feature planning", new DateTime[] {
new DateTime(2006, 8, 23), new DateTime(2006, 8, 26) }));
series2.Points.Add(new SeriesPoint("Implementation", new DateTime[] {
new DateTime(2006, 8, 26), new DateTime(2006, 9, 10) }));
// Add both series to the chart.
overlappedGanttChart.Series.AddRange(new Series[] { series1, series2 });
// Access the view-type-specific options of the series.
((GanttSeriesView)series1.View).BarWidth = 0.6;
((GanttSeriesView)series2.View).BarWidth = 0.3;
// Access the type-specific options of the diagram.
GanttDiagram myDiagram = (GanttDiagram)overlappedGanttChart.Diagram;
myDiagram.AxisY.Interlaced = true;
myDiagram.AxisY.GridSpacing = 10;
myDiagram.AxisY.Label.Angle = -30;
myDiagram.AxisY.DateTimeOptions.Format = DateTimeFormat.MonthAndDay;
// Add task links for the first Gantt series.
((GanttSeriesView)series1.View).LinkOptions.ArrowHeight = 7;
((GanttSeriesView)series1.View).LinkOptions.ArrowWidth = 11;
for (int i = 1; i < series1.Points.Count; i++) {
series1.Points[i].Relations.Add(series1.Points[i - 1]);
}
// Add a progress line.
ConstantLine progress =
new ConstantLine("Current progress", new DateTime(2006, 9, 10));
progress.ShowInLegend = false;
progress.Title.Alignment = ConstantLineTitleAlignment.Far;
myDiagram.AxisY.ConstantLines.Add(progress);
// Adjust the legend.
overlappedGanttChart.Legend.AlignmentHorizontal =
LegendAlignmentHorizontal.Right;
// Add a title to the chart (if necessary).
overlappedGanttChart.Titles.Add(new ChartTitle());
overlappedGanttChart.Titles[0].Text = "R&D Schedule";
// Add the chart to the form.
overlappedGanttChart.Dock = DockStyle.Fill;
this.Controls.Add(overlappedGanttChart);
}