SimpleDiagram3D.Dimension Property
Gets or sets the number of 3D Pie Charts that can be displayed in one line (row or column).
Namespace: DevExpress.XtraCharts
Assembly: DevExpress.XtraCharts.v19.1.dll
Declaration
[XtraSerializableProperty]
[XtraChartsLocalizableCategory(XtraChartsCategory.Layout)]
public int Dimension { get; set; }Property Value
| Type | Description |
|---|---|
| Int32 | A positive integer that specifies the number of pie charts in one line. |
Remarks
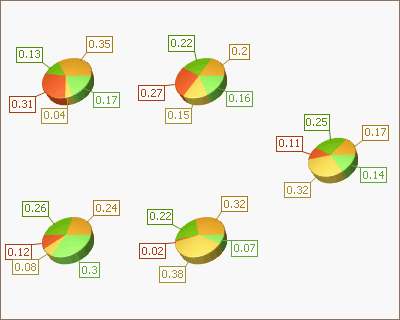
The Dimension property can be used together with the SimpleDiagram3D.LayoutDirection property to adjust the layout of pie charts within the diagram. Depending upon the SimpleDiagram3D.LayoutDirection property’s setting, pie charts are positioned in lines either horizontally (by rows) or vertically (by columns). The Dimension property specifies how many pie charts can be displayed within one row or column.
| Property Settings | LayoutDirection = Horizontal | LayoutDirection = Vertical |
|---|---|---|
| Dimension = 3 | 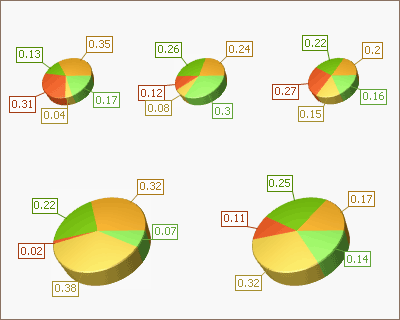 |
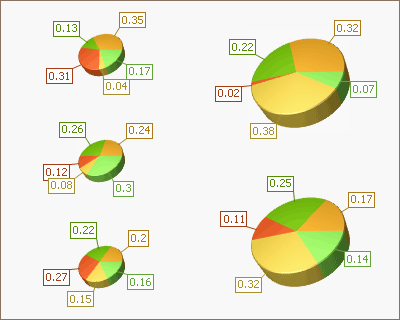 |
| Dimension = 2 | 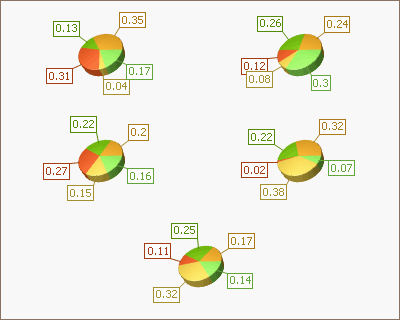 |
 |
Note
The Dimension property is calculated automatically during resizing when the ChartControl.AutoLayout or WebChartControl.AutoLayout property is set to true.
A pie chart(s) that is displayed within an incomplete row or column automatically changes its size, trying to occupy all of the available free space.