SideBySideBarSeriesView Class
Represents a series view of the Bar type.
Namespace: DevExpress.XtraCharts
Assembly: DevExpress.XtraCharts.v19.2.dll
Declaration
public class SideBySideBarSeriesView :
    BarSeriesView,
    ISideBySideBarSeriesView,
IBarSeriesViewRemarks
The SideBySideBarSeriesView class allows you to display series data points as side-by-side bars within a chart control.
In addition to the common bar view settings inherited from the base BarSeriesView class, the SideBySideBarSeriesView class declares the SideBySideBarSeriesView.BarDistanceFixed and SideBySideBarSeriesView.BarDistance properties which control the space between adjacent bars.
Note that a particular view type can be defined for a series via its SeriesBase.View property.
See the Side-by-Side Bar Chart topic for more information on series views of the simple bar type.
Example
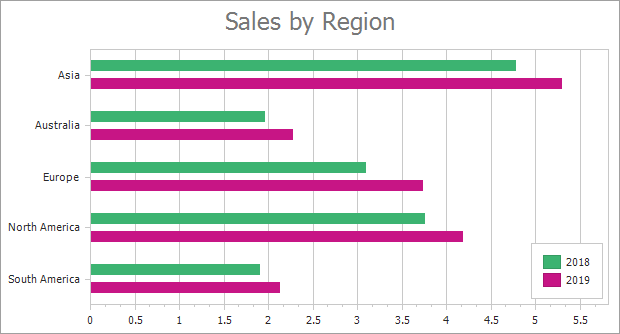
This example demonstrates how to create a ChartControl with two series of the SideBySideBarSeriesView type at runtime:
- Add a chart to the WinForms project and specify the chart’s data source.
- Create two series and add them to the chart.
- Specify data members for the series.
- Configure series view settings.
using DevExpress.XtraCharts;
using System;
using System.ComponentModel;
using System.Drawing;
using System.Windows.Forms;
// ...

namespace SideBySideBar2D {
    public partial class Form1 : Form {
        public Form1() {
            InitializeComponent();
        }
        private void Form1_Load(object sender, EventArgs e) {
            // Create an empty chart.
            ChartControl chart = new ChartControl();

            // Bind a chart to a data source.
            chart.DataSource = DataPoint.GetDataPoints();

            // Create the first series and specify its data members.
            Series series1 = new Series("2018", ViewType.Bar);
            series1.ArgumentDataMember = "Region";
            series1.ValueDataMembers.AddRange("Value1");

            // Create the second series and specify its data members.
            Series series2 = new Series("2019", ViewType.Bar);
            series2.ArgumentDataMember = "Region";
            series2.ValueDataMembers.AddRange("Value2");

            // Add series to the chart.
            chart.Series.AddRange(new Series[] { series1, series2 });

            // Change the first series's view settings.
            SideBySideBarSeriesView view1 = series1.View as SideBySideBarSeriesView;
            // The BarDistance, BarDistanceFixed, and EqualBarWidth property values are synchronized
            // in all Side-by-Side Bar Series in a ChartControl.
            // So, you can specify them only for one series view.
            view1.BarDistance = 0.1;
            view1.BarDistanceFixed = 2;
            view1.BarWidth = 0.4;
            view1.EqualBarWidth = true;
            view1.Color = Color.MediumSeaGreen;

            // Change the second series's view settings.
            SideBySideBarSeriesView view2 = series2.View as SideBySideBarSeriesView;
            view2.BarWidth = 0.4;
            view2.Color = Color.MediumVioletRed;

            // Change the legend position.
            chart.Legend.AlignmentHorizontal = LegendAlignmentHorizontal.Right;
            chart.Legend.AlignmentVertical = LegendAlignmentVertical.Bottom;

            // Rotate the diagram.
            ((XYDiagram)chart.Diagram).Rotated = true;

            // Configure the x-axis appearance.
            ((XYDiagram)chart.Diagram).AxisX.Tickmarks.MinorVisible = false;
            ((XYDiagram)chart.Diagram).AxisX.Reverse = true;

            // Add a title to the chart.
            ChartTitle chartTitle1 = new ChartTitle();
            chartTitle1.Text = "Sales by Region";
            chart.Titles.Add(chartTitle1);

            // Add the chart to the form.
            chart.Dock = DockStyle.Fill;
            this.Controls.Add(chart);
        }
    }

    public class DataPoint {
        public string Region { get; set; }
        public double Value1 { get; set; }
        public double Value2 { get; set; }
        public DataPoint(string region, double value1, double value2) {
            this.Region = region;
            this.Value1 = value1;
            this.Value2 = value2;
        }
        public static BindingList<DataPoint> GetDataPoints() {
            BindingList<DataPoint> data = new BindingList<DataPoint> {
                new DataPoint("Asia", 4.7685, 5.289),
                new DataPoint("Australia", 1.9576, 2.2727),
                new DataPoint("Europe", 3.0884, 3.7257),
                new DataPoint("North America", 3.7477, 4.1825),
                new DataPoint("South America", 1.8945, 2.1172),
            };
            return data;
        }
    }
}