SeriesNameTemplate.EndText Property
Gets or sets a postfix for the names of data bound series objects.
Namespace: DevExpress.XtraCharts
Assembly: DevExpress.XtraCharts.v19.1.dll
Declaration
Property Value
| Type | Description |
|---|---|
| String | A String value that specifies a common postfix for data bound series’ names. |
Remarks
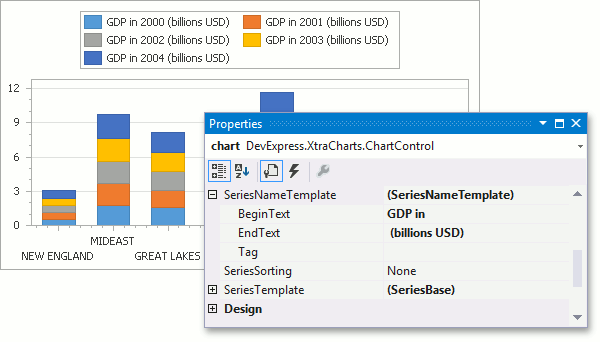
The EndText property specifies a postfix text for the names of series objects which are created dynamically as a result of chart level data binding. Typically, each such series is named based upon the value of the data field which is specified via the ChartControl.SeriesDataMember property. In order to provide a common name postfix to all series bound to data at the chart control level, the EndText property can be used.
A prefix text for series names can be specified via the SeriesNameTemplate.BeginText property.
Series names together with prefixes and postfixes specified (if any) are displayed within the legend and can be obtained via the Series.Name property of a CustomDrawSeriesEventArgsBase.Series object passed to specific events (such as the ChartControl.CustomDrawSeries) of a chart control.
The following image demonstrates this property in action.
Example
The following example demonstrates how to bind a chart to data at runtime using series templates. It uses the same approach as the design-time example, but another data table is generated in this code to simplify the example. For this example to work correctly, don’t forget to include all necessary assemblies to the References list of your project.
Note
A complete sample project is available at https://github.com/DevExpress-Examples/how-to-bind-a-chart-to-data-using-series-templates-e3
using System;
using System.Data;
using System.Windows.Forms;
using DevExpress.XtraCharts;
// ...

namespace BindUsingTemplatesRuntimeCS {
    public partial class Form1 : Form {
        public Form1() {
            InitializeComponent();
        }

        private DataTable CreateChartData() {
            // Create an empty table.
            DataTable table = new DataTable("Table1");

            // Add three columns to the table.
            table.Columns.Add("Month", typeof(String));
            table.Columns.Add("Section", typeof(String));
            table.Columns.Add("Value", typeof(Int32));

            // Add data rows to the table.
            table.Rows.Add(new object[] { "Jan", "Section1", 10 });
            table.Rows.Add(new object[] { "Jan", "Section2", 20 });
            table.Rows.Add(new object[] { "Feb", "Section1", 20 });
            table.Rows.Add(new object[] { "Feb", "Section2", 30 });
            table.Rows.Add(new object[] { "March", "Section1", 15 });
            table.Rows.Add(new object[] { "March", "Section2", 25 });

            return table;
        }

        private void Form1_Load(object sender, EventArgs e) {
            // Create a chart.
            ChartControl chart = new ChartControl();

            // Generate a data table and bind the chart to it.
            chart.DataSource = CreateChartData();

            // Specify data members to bind the chart's series template.
            chart.SeriesDataMember = "Month";
            chart.SeriesTemplate.ArgumentDataMember = "Section";
            chart.SeriesTemplate.ValueDataMembers.AddRange(new string[] {"Value"});

            // Specify the template's series view.
            chart.SeriesTemplate.View = new StackedBarSeriesView();

            // Specify the template's name prefix.
            chart.SeriesNameTemplate.BeginText = "Month: ";

            // Dock the chart into its parent, and add it to the current form.
            chart.Dock = DockStyle.Fill;
            this.Controls.Add(chart);
        }
    }
}