SeriesBase.ToolTipPointPattern Property
Gets or sets a formatting pattern for a series point tooltip.
Namespace: DevExpress.XtraCharts
Assembly: DevExpress.XtraCharts.v20.2.dll
NuGet Packages: DevExpress.Charts, DevExpress.WindowsDesktop.Charts
Declaration
[XtraChartsLocalizableCategory(XtraChartsCategory.Behavior)]
public string ToolTipPointPattern { get; set; }Property Value
| Type | Description |
|---|---|
| String | A String that specifies the tooltip pattern. |
Remarks
You can use standard and custom format specifiers with placeholders to format numeric and date/time values (for example, {V:F0}). Refer to the following article for more information: Format Specifiers.
You can also specify a pattern in the Pattern Editor (the editor is invoked when you click the ellipsis button next to the ToolTipPointPattern property in the Properties window).
The available placeholders are listed below.
| Pattern | Description |
|---|---|
| {S} | Displays the name of the series. |
| {A} | Displays a series point argument. |
| {V} | Displays series point values. |
| {HINT} | Displays a hint for a series point. |
| Pie (Donut) series specific placeholders | |
| {VP} | Displays series point values as percentages. |
| {TV} | Displays a total group value. |
| Stacked series specific placeholders | |
| {VP} | Displays series point values as percentages. |
| {G} | Displays the name of a stacked group. |
| {TV} | Displays a total group value. |
| Bubble series specific placeholders | |
| {W} | Displays the weight. |
| Range series specific placeholders | |
| {V1} | Displays the first value. |
| {V2} | Displays the second value. |
| {VD} | Displays the duration between the first and second data point values, formatted in a common time format (for example, HH:MM:SS for date time values and #.## for numeric values). |
| {VDTD} | Displays the duration between the first and second date-time data point values in days. |
| {VDTH} | Displays the duration between the first and second date-time data point values in hours. |
| {VDTM} | Displays the duration between the first and second date-time data point values in minutes. |
| {VDTS} | Displays the duration between the first and second date-time data point values in seconds. |
| {VDTMS} | Displays the duration between the first and second date-time data point values in milliseconds. |
| Financial series specific placeholders | |
| {OV} | Displays the open value. |
| {HV} | Displays the high value. |
| {LV} | Displays the low value. |
| {CV} | Displays the close value. |
Note
Specify the Series.Name property value to use the {S} placeholder.
You can also use standard and custom format specifiers with placeholders, data field values, and SeriesPoint.Tag property values (for example, {V:F1}).
When the chart control or a series is bound to data, the text pattern can contain additional data field values or Tag values. For example, if a data source contains the Discount field, the text pattern can be {S}: {V:F2} (Discount: {Discount:P0}).
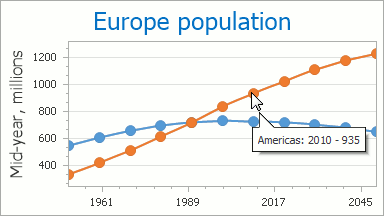
The following image shows a tooltip with the {S} {V:F2}:{A} pattern.
For more information on how to use a tooltip, refer to the Tooltip topic.
Example
This example demonstrates how to enable and customize chart tooltips at runtime.
To enable tooltips, set the ChartControl.ToolTipEnabled property to true. For more information about chart tooltips, see the Tooltips article.
The following example shows tree series with different tooltip patterns:
unboundSeries- a simple unbound series.The series shows tooltips with the following pattern:
Line Series: {A}:{V}unboundSeriesWithTag- an unbound series with a specified SeriesPoint.Tag property for each data point.The series shows tooltips with the pattern that references
Tagvalues:{A}: {V} ({Test})boundSeries- a series that is bound to the data source.The series shows tooltips with the pattern that references data source field values:
{A}: {V} ({Comment})
using DevExpress.XtraCharts;
using System;
using System.Windows.Forms;
using DevExpress.Utils;
using System.Collections.Generic;
using System.Data;

namespace TooltipCustomization {
    public partial class Form1 : Form {
        public Form1() {
            InitializeComponent();
        }
        // Create a data source.
        public class TestChartData {
            public string Argument { get; set; }
            public double Value { get; set; }
            public string Comment { get; set; }
            public TestChartData(string arguments, double value, string comment) {
                Argument = arguments;
                Value = value;
                Comment = comment;
            }

        }
        private List<TestChartData> CreateChartData() {
            var list = new List<TestChartData>();
            list.Add(new TestChartData("A", 4, "comment for A"));
            list.Add(new TestChartData("B", 2, "comment for B"));
            list.Add(new TestChartData("C", 17, "comment for C"));
            list.Add(new TestChartData("D", 4, "comment for D"));
            list.Add(new TestChartData("E", 17, "comment for E"));
            list.Add(new TestChartData("F", 12, "comment for F"));
            list.Add(new TestChartData("G", 15, "comment for G"));
            return list;
        }

        private void Form1_Load(object sender, EventArgs e) {
            // Create an empty chart.
            ChartControl chartControl = new ChartControl();

            // Add the chart to the form.
            chartControl.Dock = DockStyle.Fill;
            this.Controls.Add(chartControl);

            // Create a series and add points to it.
            Series boundSeries = new Series("Bound Series", ViewType.Line);
            // Assign the created data source to the series.
            boundSeries.DataSource = CreateChartData();
            boundSeries.ArgumentScaleType = ScaleType.Auto;
            boundSeries.ArgumentDataMember = "Argument";
            boundSeries.ValueScaleType = ScaleType.Numerical;
            boundSeries.ValueDataMembers.AddRange(new string[] { "Value" });

            Series unboundSeries = new Series("Unbound Series", ViewType.Line);
            unboundSeries.Points.Add(new SeriesPoint("A", new double[] { 9 }));
            unboundSeries.Points.Add(new SeriesPoint("B", new double[] { 7 }));
            unboundSeries.Points.Add(new SeriesPoint("C", new double[] { 23 }));
            unboundSeries.Points.Add(new SeriesPoint("D", new double[] { 9 }));
            unboundSeries.Points.Add(new SeriesPoint("E", new double[] { 23 }));
            unboundSeries.Points.Add(new SeriesPoint("F", new double[] { 17 }));
            unboundSeries.Points.Add(new SeriesPoint("G", new double[] { 20 }));

            Series unboundSeriesWithTag = new Series("Unbound Series with Tag", ViewType.Line);
            unboundSeriesWithTag.Points.Add(new SeriesPoint("A", 2) { Tag = new { Test = "TestValue" } });
            unboundSeriesWithTag.Points.Add(new SeriesPoint("B", 0) { Tag = new { Test = "TestValue" } });
            unboundSeriesWithTag.Points.Add(new SeriesPoint("C", 15) { Tag = new { Test = "TestValue" } });
            unboundSeriesWithTag.Points.Add(new SeriesPoint("D", 2) { Tag = new { Test = "TestValue" } });
            unboundSeriesWithTag.Points.Add(new SeriesPoint("E", 15) { Tag = new { Test = "TestValue" } });
            unboundSeriesWithTag.Points.Add(new SeriesPoint("F", 10) { Tag = new { Test = "TestValue" } });
            unboundSeriesWithTag.Points.Add(new SeriesPoint("G", 13) { Tag = new { Test = "TestValue" } });

            // Add the series to the chart.
            chartControl.Series.AddRange(unboundSeries, unboundSeriesWithTag, boundSeries);
            // Enable data point markers.
            ((LineSeriesView)unboundSeries.View).MarkerVisibility = DefaultBoolean.True;
            ((LineSeriesView)unboundSeriesWithTag.View).MarkerVisibility = DefaultBoolean.True;
            ((LineSeriesView)boundSeries.View).MarkerVisibility = DefaultBoolean.True;
            // Disable a crosshair cursor.
            chartControl.CrosshairEnabled = DefaultBoolean.False;

            // Enable chart tooltips.
            chartControl.ToolTipEnabled = DefaultBoolean.True;

            // Show a tooltip's beak.
            ToolTipController controller = new ToolTipController();
            chartControl.ToolTipController = controller;
            controller.ShowBeak = true;

            // Change the default tooltip mouse position to relative position.
            ToolTipRelativePosition relativePosition = new ToolTipRelativePosition();
            chartControl.ToolTipOptions.ToolTipPosition = relativePosition;

            // Specify the tooltip relative position offsets.
            relativePosition.OffsetX = 2;
            relativePosition.OffsetY = 2;

            // Specify the tooltip point pattern.
            unboundSeries.ToolTipPointPattern = "Line Series: {A}:{V}";
            unboundSeriesWithTag.ToolTipPointPattern = "{A}: {V} ({Test})";
            boundSeries.ToolTipPointPattern = "{A}: {V} ({Comment})";
        }
    }
}
Related GitHub Examples
The following code snippet (auto-collected from DevExpress Examples) contains a reference to the ToolTipPointPattern property.
Note
The algorithm used to collect these code examples remains a work in progress. Accordingly, the links and snippets below may produce inaccurate results. If you encounter an issue with code examples below, please use the feedback form on this page to report the issue.