SeriesBase.CrosshairLabelPattern Property
Gets or sets a string which represents the pattern specifying the text to be displayed within a crosshair label for the current Series type.
Namespace: DevExpress.XtraCharts
Assembly: DevExpress.XtraCharts.v20.2.dll
NuGet Packages: DevExpress.Charts, DevExpress.WindowsDesktop.Charts
Declaration
[XtraChartsLocalizableCategory(XtraChartsCategory.Behavior)]
public string CrosshairLabelPattern { get; set; }Property Value
| Type | Description |
|---|---|
| String | A String, which represents a crosshair label pattern. The default value is Empty. |
Remarks
Use the CrosshairLabelPattern property to define a display pattern that determines the text to be displayed in crosshair labels for a particular Series.
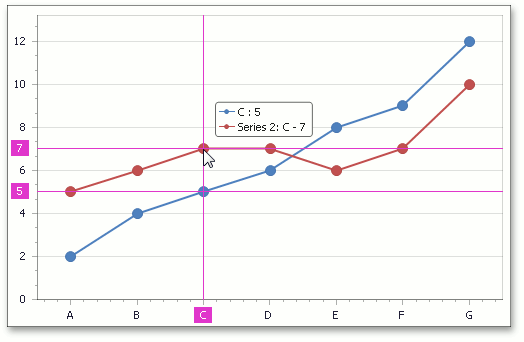
For example, the following image shows two crosshair label patterns: “{A:V}” for the first Line Series, and “{S}: {A} - {V}” for the second Line series:
In addition, you can specify a pattern using the Pattern Editor (the editor is invoked by clicking the ellipsis button of the CrosshairLabelPattern property in the Properties window).
A full list of available placeholders is detailed below.
| Pattern | Description |
|---|---|
| {S} | Displays the name of the series. |
| {A} | Displays a series point argument. |
| {V} | Displays series point values. |
| Pie (Donut) series specific placeholders | |
| {VP} | Displays series point values as percentages. |
| {TV} | Displays a total group value. |
| Stacked series specific placeholders | |
| {VP} | Displays series point values as percentages. |
| {G} | Displays the name of a stacked group. |
| {TV} | Displays a total group value. |
| Bubble series specific placeholders | |
| {W} | Displays the weight. |
| Range series specific placeholders | |
| {V1} | Displays the first value. |
| {V2} | Displays the second value. |
| {VD} | Displays the duration between the first and second data point values formatted using a common time format (e.g. HH:MM:SS for date time values and #.## for numeric values). |
| {VDTD} | Displays the duration between the first and second date-time data point values in days. |
| {VDTH} | Displays the duration between the first and second date-time data point values in hours. |
| {VDTM} | Displays the duration between the first and second date-time data point values in minutes. |
| {VDTS} | Displays the duration between the first and second date-time data point values in seconds. |
| {VDTMS} | Displays the duration between the first and second date-time data point values in milliseconds. |
| Financial series specific placeholders | |
| {OV} | Displays the open value. |
| {HV} | Displays the high value. |
| {LV} | Displays the low value. |
| {CV} | Displays the close value. |
Note
Make sure before using the {S} placeholder that the Series.Name property is specified.
When the chart control or a series is bound to data, the text pattern may contain data field values in addition to default placeholders. For example, the data source contains the Discount field and the text pattern may look like: {S}: {V:F2} (Discount: {Discount:P0}).
You can also use standard and custom format specifiers together with the placeholders to format numeric and date/time values (for example, {V:F1}). To learn more, see the Format Specifiers topic.
Example
This example demonstrates how to change a text displayed in crosshair labels using crosshair format patterns.
To accomplish this, it is necessary to specify a string which will represent the pattern displayed within a crosshair label using the CrosshairAxisLabelOptions.Pattern, SeriesBase.CrosshairLabelPattern, and CrosshairOptions.GroupHeaderPattern properties.
In addition, standard and custom format specifiers are used together with the placeholders to format numeric and date/time values (e.g., “{A:F0}”). To learn more, see the Format Specifiers topic.
To learn more on crosshair cursors, see the Tooltip and Crosshair Cursor topic.
Note
A complete sample project is available at https://github.com/DevExpress-Examples/how-to-format-values-in-a-crosshair-cursor-via-a-labels-patterns-e4490
using System;
using System.Windows.Forms;
using DevExpress.XtraCharts;

namespace FormatCrosshairLabels
{
    public partial class Form1 : Form
    {
        public Form1()
        {
            this.Load += new System.EventHandler(this.Form1_Load);
        }

        private void Form1_Load(object sender, EventArgs e)
        {
            // Create an empty chart.
            ChartControl chartControl1 = new ChartControl();

            // Create a first line series and add points to it.
            Series series1 = new Series("Europe", ViewType.Line);
            series1.Points.Add(new SeriesPoint(1950, 546));
            series1.Points.Add(new SeriesPoint(1960, 605));
            series1.Points.Add(new SeriesPoint(1970, 656));
            series1.Points.Add(new SeriesPoint(1980, 694));
            series1.Points.Add(new SeriesPoint(1990, 721));
            series1.Points.Add(new SeriesPoint(2000, 730));
            series1.Points.Add(new SeriesPoint(2010, 728));

            // Create a second line series and add points to it.
            Series series2 = new Series("Americas", ViewType.Line);
            series2.Points.Add(new SeriesPoint(1950, 332));
            series2.Points.Add(new SeriesPoint(1960, 417));
            series2.Points.Add(new SeriesPoint(1970, 513));
            series2.Points.Add(new SeriesPoint(1980, 614));
            series2.Points.Add(new SeriesPoint(1990, 721));
            series2.Points.Add(new SeriesPoint(2000, 836));
            series2.Points.Add(new SeriesPoint(2010, 935));

            // Add the series to the chart.
            chartControl1.Series.Add(series1);
            chartControl1.Series.Add(series2);

            // Hide the legend (if necessary).
            chartControl1.Legend.Visible = false;

            //Show crosshair axis lines and crosshair axis labels to see format values of crosshair labels
            chartControl1.CrosshairOptions.ShowArgumentLabels = true;
            chartControl1.CrosshairOptions.ShowValueLabels = true;
            chartControl1.CrosshairOptions.ShowValueLine = true;
            chartControl1.CrosshairOptions.ShowArgumentLine = true;

            // Specify the crosshair label pattern for both series.
            series1.CrosshairLabelPattern = "{S} population: {V}";
            series2.CrosshairLabelPattern = "{S} population: {V}";

            // Specify the crosshair group header pattern.
            chartControl1.CrosshairOptions.GroupHeaderPattern = "Year: {A}";

            // Cast the chart's diagram to the XYDiagram type, to access its axes.
            XYDiagram diagram = (XYDiagram)chartControl1.Diagram;

            // Specify the crosshair axis labels pattern for X-axis.
            diagram.AxisX.CrosshairAxisLabelOptions.Pattern = "Year: {A:F0}";

            // Add the chart to the form.
            chartControl1.Dock = DockStyle.Fill;
            this.Controls.Add(chartControl1);
        }

    }
}
Related GitHub Examples
The following code snippet (auto-collected from DevExpress Examples) contains a reference to the CrosshairLabelPattern property.
Note
The algorithm used to collect these code examples remains a work in progress. Accordingly, the links and snippets below may produce inaccurate results. If you encounter an issue with code examples below, please use the feedback form on this page to report the issue.