ScaleGridOptionsBase.GridSpacing Property
Gets or sets the interval between grid lines and major tickmarks.
Namespace: DevExpress.XtraCharts
Assembly: DevExpress.XtraCharts.v23.2.dll
NuGet Package: DevExpress.Charts
Declaration
[XtraChartsLocalizableCategory(XtraChartsCategory.Behavior)]
public double GridSpacing { get; set; }Property Value
| Type | Description |
|---|---|
| Double | The interval between grid lines and major tickmarks, in units specified by the NumericScaleOptions.GridAlignment (DateTimeScaleOptions.GridAlignment or TimeSpanScaleOptions.GridAlignment. |
Remarks
This feature manages label placement along the axis. By default, the ScaleGridOptionsBase.AutoGrid is true, and the GridSpacing is set automatically. If you wish to change the step interval for axis labeling, specify the interval between grid alignment units by the GridSpacing property value.
It is important to note that the GridSpacing and ScaleGridOptionsBase.AutoGrid properties are interdependent - changing the value of one property affects the value of the other.
The following images demonstrate how the GridSpacing property works.
AutoGrid = true; (auto) GridSpacing=1; (auto) GridAlignment=”Week”; (auto) MeasureUnit=”Day”; | AutoGrid = false; GridSpacing=3; GridAlignment=”Day”; MeasureUnit=”Day”; |
|---|---|
|
|


Note
If the AxisBase.Logarithmic scale is enabled, the GridSpacing property value is rounded to integer values. Note that since GridSpacing can’t be set to 0, if its value is less than 1 (e.g., 0.1) it is always rounded to 1.
For more information, refer to Axis Scale Types.
Example
This example shows how to use NumericScaleOptions to reduce the number of visible series points.
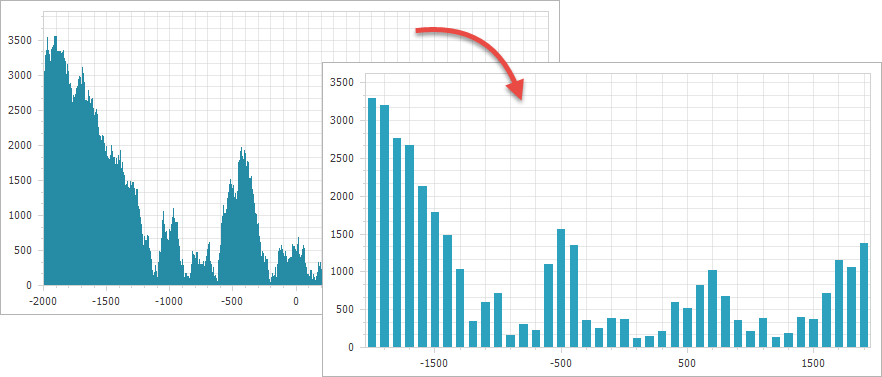
The following code configures the axis scale settings to resemble to the chart appearance above:
NumericScaleOptions numericScaleOptions = ((XYDiagram)chartControl.Diagram).AxisX.NumericScaleOptions;

numericScaleOptions.ScaleMode = ScaleMode.Manual;
numericScaleOptions.MeasureUnit = NumericMeasureUnit.Hundreds;
numericScaleOptions.GridOffset = 5;
numericScaleOptions.AggregateFunction = AggregateFunction.Average;
numericScaleOptions.GridAlignment = NumericGridAlignment.Thousands;
numericScaleOptions.GridSpacing = 1;
The following table lists the API members the code above uses:
| Member | Description |
|---|---|
| AxisBase.NumericScaleOptions | Stores the options that define the behavior of a scale when its type is numeric. |
| ScaleOptionsBase.ScaleMode | Gets or sets the scale mode for an axis. |
| ScaleMode | Lists the values that specify the scale mode for an axis. |
| NumericScaleOptions.MeasureUnit | Gets or sets the detail level for numeric values. |
| NumericMeasureUnit | Lists the values that specify the detail level for numeric values. |
| ScaleGridOptionsBase.GridOffset | Gets or sets the offset of grid lines and major tickmarks. |
| ScaleGridOptionsBase.AggregateFunction | Gets or sets the value indicating the aggregate function that should be used to relieve data. |
| AggregateFunction | Lists the values that specify the aggregate function used for an axis. |
| NumericScaleOptions.GridAlignment | Gets or sets the numeric measure unit to which the beginning of an axis’ gridlines and labels should be aligned. |
| NumericGridAlignment | Lists the values that specify the numeric-time measurement unit, to which the beginning of a diagram’s gridlines and labels should be aligned. |
ScaleGridOptionsBase.GridSpacing |
Gets or sets the interval between grid lines and major tickmarks. |
Related GitHub Examples
The following code snippets (auto-collected from DevExpress Examples) contain references to the GridSpacing property.
Note
The algorithm used to collect these code examples remains a work in progress. Accordingly, the links and snippets below may produce inaccurate results. If you encounter an issue with code examples below, please use the feedback form on this page to report the issue.