RadarDiagram.DrawingStyle Property
Gets or sets the shape style of a grid used to plot a Radar chart.
Namespace: DevExpress.XtraCharts
Assembly: DevExpress.XtraCharts.v18.2.dll
Declaration
[XtraChartsLocalizableCategory(XtraChartsCategory.Appearance)]
[XtraSerializableProperty]
public RadarDiagramDrawingStyle DrawingStyle { get; set; }Property Value
| Type | Description |
|---|---|
| RadarDiagramDrawingStyle | A RadarDiagramDrawingStyle enumeration member, specifying the shape of a radar diagram. |
Available values:
| Name | Description |
|---|---|
| Circle | A circular diagram is drawn as a circle. |
| Polygon | A circular diagram is drawn as a polygon. |
Remarks
Use the DrawingStyle property to specify a circular or polygonal grid for drawing a radar chart.
The following images demonstrate this property in action.
| DrawingStyle = Circle | DrawingStyle = Polygon |
|---|---|
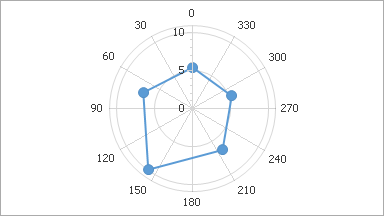 |
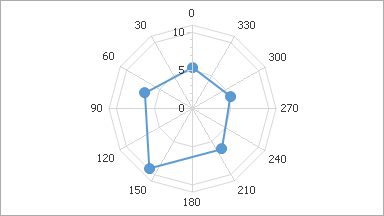 |
Example
The following example demonstrates how to create a ChartControl with a series of the RadarPointSeriesView type, set its general properties, and add this chart to a form at runtime. Before proceeding with this example, first create a Windows Forms Application in Visual Studio, and include all necessary assemblies to the References list of your project.
Then, add the following code to the Form.Load event handler.
using System;
using System.Windows.Forms;
using DevExpress.XtraCharts;
// ...

private void Form1_Load(object sender, EventArgs e) {
    // Create a new chart.
    ChartControl RadarPointChart = new ChartControl();

    // Add a radar series to it.
    Series series1 = new Series("Series 1", ViewType.RadarPoint);

    // Populate the series with points.
    series1.Points.Add(new SeriesPoint(0, 90));
    series1.Points.Add(new SeriesPoint(90, 95));
    series1.Points.Add(new SeriesPoint(180, 50));
    series1.Points.Add(new SeriesPoint(270, 55));
    series1.Points.Add(new SeriesPoint(0, 180));
    series1.Points.Add(new SeriesPoint(90, 185));
    series1.Points.Add(new SeriesPoint(180, 270));
    series1.Points.Add(new SeriesPoint(270, 275));

    // Add the series to the chart.
    RadarPointChart.Series.Add(series1);

    // Flip the diagram (if necessary).
    ((RadarDiagram)RadarPointChart.Diagram).StartAngleInDegrees = 180;
    ((RadarDiagram)RadarPointChart.Diagram).RotationDirection =
        RadarDiagramRotationDirection.Counterclockwise;

    // Add a title to the chart and hide the legend.
    ChartTitle chartTitle1 = new ChartTitle();
    chartTitle1.Text = "Radar Point Chart";
    RadarPointChart.Titles.Add(chartTitle1);
    RadarPointChart.Legend.Visible = false;

    // Add the chart to the form.
    RadarPointChart.Dock = DockStyle.Fill;
    this.Controls.Add(RadarPointChart);
}