PieSeriesView Class
Represents a series view of the Pie type.
Namespace: DevExpress.XtraCharts
Assembly: DevExpress.XtraCharts.v23.2.dll
NuGet Package: DevExpress.Charts
Declaration
Remarks
The PieSeriesView class provides the functionality of a series view of the pie type within a chart control.
In addition to the common view settings inherited from the base SeriesViewBase class, the PieSeriesView class declares the pie type specific settings which allow you to define the view’s border settings (PieSeriesView.Border), background fill style (PieSeriesView.FillStyle), the ratio of the pie’s height and width (PieSeriesView.HeightToWidthRatio) and the rotation angle of the pie (PieSeriesView.Rotation).
Note that a particular view type can be defined for a series via its SeriesBase.View property.
For more information on series views of the pie type, please see the Pie Chart topic.
Example
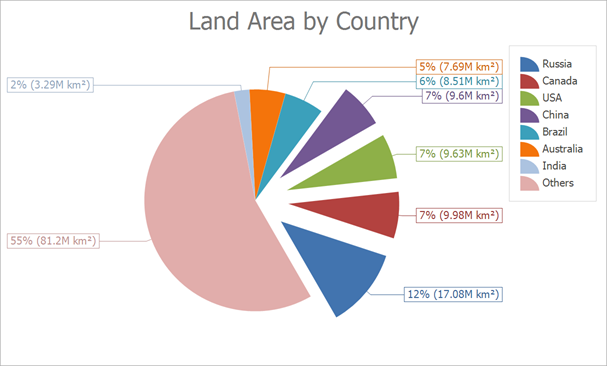
The following example shows how to create a Pie chart at runtime.
The Chart Control uses the Simple Diagram to display pies. Cast the ChartControl.Diagram property to the SimpleDiagram type to access diagram settings. The Chart Control determines the diagram type based on the series that is added first. We recommend that you access the diagram to configure its settings after at least one series is added to the chart.
To access pie series view settings, cast the SeriesBase.View property to the PieSeriesView type.
using System;
using System.Collections.Generic;
using System.Windows.Forms;
using DevExpress.XtraCharts;

namespace Series_PieChart {
    public partial class Form1 : DevExpress.XtraEditors.XtraForm {
        public Form1() {
            InitializeComponent();
        }
        private void Form1_Load(object sender, EventArgs e) {
            // Create an empty chart.
            ChartControl pieChart = new ChartControl();

            pieChart.Titles.Add(new ChartTitle() { Text = "Land Area by Country" });

            // Create a pie series.
            Series series1 = new Series("Land Area by Country", ViewType.Pie);

            // Bind the series to data.
            series1.DataSource = DataPoint.GetDataPoints();
            series1.ArgumentDataMember = "Argument";
            series1.ValueDataMembers.AddRange(new string[] { "Value" });

            // Add the series to the chart.
            pieChart.Series.Add(series1);

            // Access diagram settings.
            SimpleDiagram diagram = (SimpleDiagram)pieChart.Diagram;
            diagram.Margins.All = 10;

            // Format the the series labels.
            series1.Label.TextPattern = "{VP:p0} ({V:.##}M km²)";

            // Format the series legend items.
            series1.LegendTextPattern = "{A}";

            // Adjust the position of series labels.
            ((PieSeriesLabel)series1.Label).Position = PieSeriesLabelPosition.TwoColumns;

            // Detect overlapping of series labels.
            ((PieSeriesLabel)series1.Label).ResolveOverlappingMode = ResolveOverlappingMode.Default;

            // Access the view-type-specific options of the series.
            PieSeriesView myView = (PieSeriesView)series1.View;

            // Specify the pie rotation.
            myView.Rotation = -60;

            // Specify a data filter to explode points.
            myView.ExplodedPointsFilters.Add(new SeriesPointFilter(SeriesPointKey.Value_1,
                DataFilterCondition.GreaterThanOrEqual, 9));
            myView.ExplodedPointsFilters.Add(new SeriesPointFilter(SeriesPointKey.Argument,
                DataFilterCondition.NotEqual, "Others"));
            myView.ExplodeMode = PieExplodeMode.UseFilters;
            myView.ExplodedDistancePercentage = 30;
            myView.RuntimeExploding = true;

            // Customize the legend.
            pieChart.Legend.Visibility = DevExpress.Utils.DefaultBoolean.True;

            // Add the chart to the form.
            pieChart.Dock = DockStyle.Fill;
            this.Controls.Add(pieChart);
        }
    }
    public class DataPoint {
        public string Argument { get; set; }
        public double Value { get; set; }

        public static List<DataPoint> GetDataPoints() {
            return new List<DataPoint> {
                    new DataPoint { Argument = "Russia",    Value = 17.0752},
                    new DataPoint { Argument = "Canada",    Value = 9.98467},
                    new DataPoint { Argument = "USA",       Value = 9.63142},
                    new DataPoint { Argument = "China",     Value = 9.59696},
                    new DataPoint { Argument = "Brazil",    Value = 8.511965},
                    new DataPoint { Argument = "Australia", Value = 7.68685},
                    new DataPoint { Argument = "India",     Value = 3.28759},
                    new DataPoint { Argument = "Others",    Value = 81.2}
                };
        }
    }
}