PieSeriesView.Rotation Property
Gets or sets the angle by which pie slices are rotated.
Namespace: DevExpress.XtraCharts
Assembly: DevExpress.XtraCharts.v18.2.dll
Declaration
[XtraSerializableProperty]
[XtraChartsLocalizableCategory(XtraChartsCategory.Layout)]
public int Rotation { get; set; }Property Value
| Type | Description |
|---|---|
| Int32 | An integer value that specifies the angle, in degrees. |
Remarks
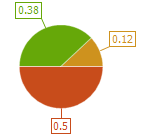
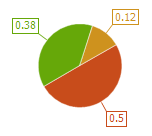
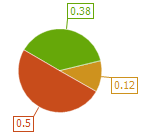
The angle, which is specified by this property, is measured in degrees and is counterclockwise.
| 0 | 30 | -30 |
|---|---|---|
 |
 |
 |
Example
The following example demonstrates how to create a ChartControl with a series of the PieSeriesView type, and add this chart to a form at runtime.
Note that this series view type is associated with the SimpleDiagram type, and you should cast your diagram object to this type, in order to access its specific options.
Note
A complete sample project is available at https://github.com/DevExpress-Examples/how-to-create-a-pie-chart-e1189
using System;
using System.Windows.Forms;
using DevExpress.XtraCharts;
// ...

namespace Series_PieChart {
    public partial class Form1 : Form {
        public Form1() {
            InitializeComponent();
        }

        private void Form1_Load(object sender, EventArgs e) {
            // Create an empty chart.
            ChartControl pieChart = new ChartControl();

            // Create a pie series.
            Series series1 = new Series("A Pie Series", ViewType.Pie);

            // Populate the series with points.
            series1.Points.Add(new SeriesPoint("Russia", 17.0752));
            series1.Points.Add(new SeriesPoint("Canada", 9.98467));
            series1.Points.Add(new SeriesPoint("USA", 9.63142));
            series1.Points.Add(new SeriesPoint("China", 9.59696));
            series1.Points.Add(new SeriesPoint("Brazil", 8.511965));
            series1.Points.Add(new SeriesPoint("Australia", 7.68685));
            series1.Points.Add(new SeriesPoint("India", 3.28759));
            series1.Points.Add(new SeriesPoint("Others", 81.2));

            // Add the series to the chart.
            pieChart.Series.Add(series1);

            // Format the the series labels.
            series1.Label.TextPattern = "{A}: {VP:p0}";

            // Adjust the position of series labels.
            ((PieSeriesLabel)series1.Label).Position = PieSeriesLabelPosition.TwoColumns;

            // Detect overlapping of series labels.
            ((PieSeriesLabel)series1.Label).ResolveOverlappingMode = ResolveOverlappingMode.Default;

            // Access the view-type-specific options of the series.
            PieSeriesView myView = (PieSeriesView)series1.View;

            // Show a title for the series.
            myView.Titles.Add(new SeriesTitle());
            myView.Titles[0].Text = series1.Name;

            // Specify a data filter to explode points.
            myView.ExplodedPointsFilters.Add(new SeriesPointFilter(SeriesPointKey.Value_1,
                DataFilterCondition.GreaterThanOrEqual, 9));
            myView.ExplodedPointsFilters.Add(new SeriesPointFilter(SeriesPointKey.Argument,
                DataFilterCondition.NotEqual, "Others"));
            myView.ExplodeMode = PieExplodeMode.UseFilters;
            myView.ExplodedDistancePercentage = 30;
            myView.RuntimeExploding = true;
            myView.HeightToWidthRatio = 0.75;

            // Hide the legend (if necessary).
            pieChart.Legend.Visibility = DevExpress.Utils.DefaultBoolean.False;

            // Add the chart to the form.
            pieChart.Dock = DockStyle.Fill;
            this.Controls.Add(pieChart);
        }
    }
}
See Also