PieSeriesLabel.Position Property
Gets or sets the position of labels relative to each other and the pie diagram.
Namespace: DevExpress.XtraCharts
Assembly: DevExpress.XtraCharts.v21.2.dll
NuGet Package: DevExpress.Charts
Declaration
[XtraChartsLocalizableCategory(XtraChartsCategory.Behavior)]
public PieSeriesLabelPosition Position { get; set; }Property Value
| Type | Description |
|---|---|
| PieSeriesLabelPosition | An PieSeriesLabelPosition enumeration value which specifies the position of labels relative to each other and to the pie diagram. |
Available values:
| Name | Description |
|---|---|
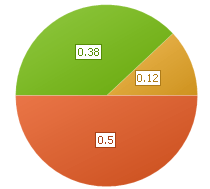
| Inside | Specifies that point labels should be painted directly on the corresponding slice of a Pie chart.
|
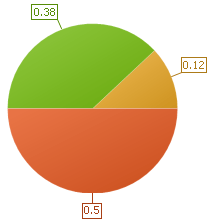
| Outside | Specifies that point labels should be painted outside a Pie chart, near the corresponding slice.
|
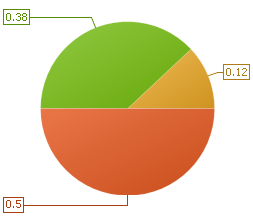
| TwoColumns | Specifies that point labels should be painted outside a Pie chart and organized into two columns on the left and right of the Pie chart.
|
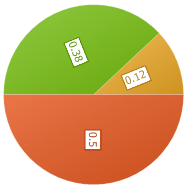
| Radial | Specifies that point labels should be painted radially on the corresponding slices of a Pie chart.
|
| Tangent | Specifies that point labels should be painted tangentially on the corresponding slices of a Pie chart.
|
Remarks
Refer to the PieSeriesLabelPosition enumeration’s description for a list of the available label positions.
Example
The following example demonstrates how to create a ChartControl with a series of the PieSeriesView type, and add this chart to a form at runtime.
Note that this series view type is associated with the SimpleDiagram type, and you should cast your diagram object to this type, in order to access its specific options.
Note
A complete sample project is available at https://github.com/DevExpress-Examples/winforms-charts-create-a-pie-chart
using System;
using System.Windows.Forms;
using DevExpress.XtraCharts;
// ...

namespace Series_PieChart {
    public partial class Form1 : Form {
        public Form1() {
            InitializeComponent();
        }

        private void Form1_Load(object sender, EventArgs e) {
            // Create an empty chart.
            ChartControl pieChart = new ChartControl();

            // Create a pie series.
            Series series1 = new Series("A Pie Series", ViewType.Pie);

            // Populate the series with points.
            series1.Points.Add(new SeriesPoint("Russia", 17.0752));
            series1.Points.Add(new SeriesPoint("Canada", 9.98467));
            series1.Points.Add(new SeriesPoint("USA", 9.63142));
            series1.Points.Add(new SeriesPoint("China", 9.59696));
            series1.Points.Add(new SeriesPoint("Brazil", 8.511965));
            series1.Points.Add(new SeriesPoint("Australia", 7.68685));
            series1.Points.Add(new SeriesPoint("India", 3.28759));
            series1.Points.Add(new SeriesPoint("Others", 81.2));

            // Add the series to the chart.
            pieChart.Series.Add(series1);

            // Format the the series labels.
            series1.Label.TextPattern = "{A}: {VP:p0}";

            // Adjust the position of series labels.
            ((PieSeriesLabel)series1.Label).Position = PieSeriesLabelPosition.TwoColumns;

            // Detect overlapping of series labels.
            ((PieSeriesLabel)series1.Label).ResolveOverlappingMode = ResolveOverlappingMode.Default;

            // Access the view-type-specific options of the series.
            PieSeriesView myView = (PieSeriesView)series1.View;

            // Show a title for the series.
            myView.Titles.Add(new SeriesTitle());
            myView.Titles[0].Text = series1.Name;

            // Specify a data filter to explode points.
            myView.ExplodedPointsFilters.Add(new SeriesPointFilter(SeriesPointKey.Value_1,
                DataFilterCondition.GreaterThanOrEqual, 9));
            myView.ExplodedPointsFilters.Add(new SeriesPointFilter(SeriesPointKey.Argument,
                DataFilterCondition.NotEqual, "Others"));
            myView.ExplodeMode = PieExplodeMode.UseFilters;
            myView.ExplodedDistancePercentage = 30;
            myView.RuntimeExploding = true;
            myView.HeightToWidthRatio = 0.75;

            // Hide the legend (if necessary).
            pieChart.Legend.Visibility = DevExpress.Utils.DefaultBoolean.False;

            // Add the chart to the form.
            pieChart.Dock = DockStyle.Fill;
            this.Controls.Add(pieChart);
        }
    }
}