NumericScaleOptions.MeasureUnit Property
Gets or sets the detail level for numeric values.
Namespace: DevExpress.XtraCharts
Assembly: DevExpress.XtraCharts.v21.2.dll
NuGet Package: DevExpress.Charts
Declaration
Property Value
| Type | Description |
|---|---|
| NumericMeasureUnit | A NumericMeasureUnit enumeration value which represents the axis’ detail level. |
Available values:
| Name | Description |
|---|---|
| Ones | Specifies ones as the measurement unit for numeric values. |
| Tens | Specifies tens as the measurement unit for numeric values. |
| Hundreds | Specifies hundreds as the measurement unit for numeric values. |
| Thousands | Specifies thousands as the measurement unit for numeric values. |
| Millions | Specifies millions as the measurement unit for numeric values. |
| Billions | Specifies billions as the measurement unit for numeric values. |
| Custom | The measurement unit for numeric values is specified by the NumericScaleOptions.CustomMeasureUnit property. |
Property Paths
You can access this nested property as listed below:
| Object Type | Path to MeasureUnit |
|---|---|
| AxisBase |
|
Remarks
This property is available when the SeriesBase.ArgumentScaleType is set to either Auto or Numeric, the SeriesBase.ValueScaleType property is set to Numeric, and the ScaleOptionsBase.ScaleMode property is set to Manual.
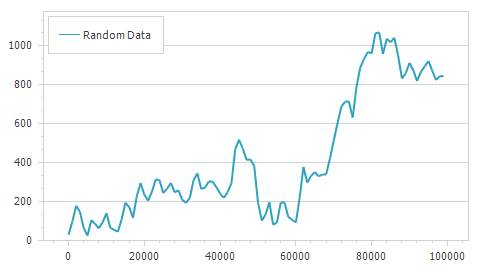
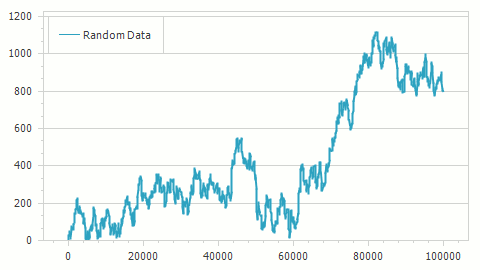
| NumericScaleOptions.MeasureUnit = Thousands | NumericScaleOptions.MeasureUnit = Hundreds |
|---|---|
 |
 |
Note
To access NumericScaleOptions, use the AxisBase.NumericScaleOptions property.
To define a numeric measurement unit to which the beginning of a diagram’s gridlines and labels should be aligned, use the NumericScaleOptions.GridAlignment property.
Example
This example shows how to use NumericScaleOptions to reduce the number of visible series points.
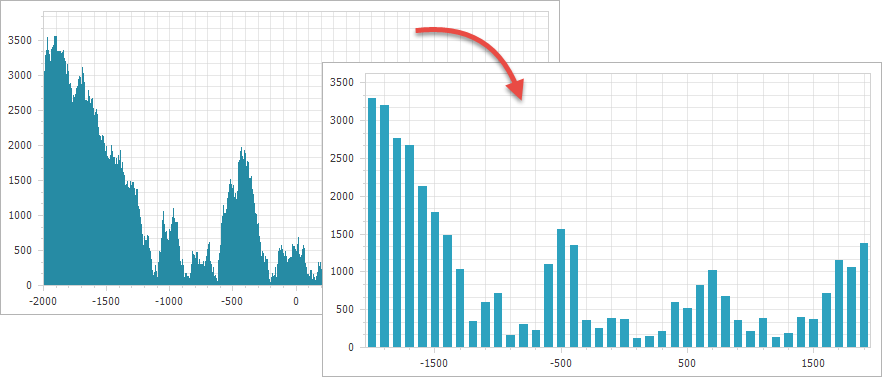
The following code configures the axis scale settings to resemble to the chart appearance above:
NumericScaleOptions numericScaleOptions = ((XYDiagram)chartControl.Diagram).AxisX.NumericScaleOptions;

numericScaleOptions.ScaleMode = ScaleMode.Manual;
numericScaleOptions.MeasureUnit = NumericMeasureUnit.Hundreds;
numericScaleOptions.GridOffset = 5;
numericScaleOptions.AggregateFunction = AggregateFunction.Average;
numericScaleOptions.GridAlignment = NumericGridAlignment.Thousands;
numericScaleOptions.GridSpacing = 1;
The following table lists the API members the code above uses:
| Member | Description |
|---|---|
| AxisBase.NumericScaleOptions | Stores the options that define the behavior of a scale when its type is numeric. |
| ScaleOptionsBase.ScaleMode | Gets or sets the scale mode for an axis. |
| ScaleMode | Lists the values that specify the scale mode for an axis. |
NumericScaleOptions.MeasureUnit |
Gets or sets the detail level for numeric values. |
| NumericMeasureUnit | Lists the values that specify the detail level for numeric values. |
| ScaleGridOptionsBase.GridOffset | Gets or sets the offset of grid lines and major tickmarks. |
| ScaleGridOptionsBase.AggregateFunction | Gets or sets the value indicating the aggregate function that should be used to relieve data. |
| AggregateFunction | Lists the values that specify the aggregate function used for an axis. |
| NumericScaleOptions.GridAlignment | Gets or sets the numeric measure unit to which the beginning of an axis’ gridlines and labels should be aligned. |
| NumericGridAlignment | Lists the values that specify the numeric-time measurement unit, to which the beginning of a diagram’s gridlines and labels should be aligned. |
| ScaleGridOptionsBase.GridSpacing | Gets or sets the interval between grid lines and major tickmarks. |