LegendDirection Enum
Lists the values that specify the layout of legend entries associated with the series in the ChartControl.Series collection.
Namespace: DevExpress.XtraCharts
Assembly: DevExpress.XtraCharts.v23.2.dll
NuGet Package: DevExpress.Charts
Declaration
[ResourceFinder(typeof(XtraChartsResFinder), "PropertyNamesRes")]
public enum LegendDirectionMembers
| Name | Description |
|---|---|
TopToBottom
|
Specifies that legend entries are positioned vertically from the top to the bottom of the legend according to the indexes of the corresponding series within the ChartControl.Series collection. The lower the index that a series object has in the ChartControl.Series collection, the higher position its legend entry has within the legend. |
BottomToTop
|
Specifies that legend entries are positioned vertically from the bottom to the top of the legend according to the indexes of the corresponding series within the ChartControl.Series collection. The lower index that a series object has in the ChartControl.Series collection, the lower position its legend entry has within the legend. |
LeftToRight
|
Specifies that legend entries are positioned horizontally from the left to the right of the legend according to the indexes of the corresponding series within the ChartControl.Series collection. The lower index that a series object has in the ChartControl.Series collection, the closer to the left bound its legend entry is positioned within the legend. |
RightToLeft
|
Specifies that legend entries are positioned horizontally from the right to the left of the legend according to the indexes of the corresponding series within the ChartControl.Series collection. The lower index a series object has in the ChartControl.Series collection, the closer to the right bound its legend entry is positioned within the legend. |
Related API Members
The following properties accept/return LegendDirection values:
| Library | Related API Members |
|---|---|
| Cross-Platform Class Library | LegendBase.Direction |
| WinForms Controls | LegendBaseModel.Direction |
Remarks
The values listed by the LegendDirection enumeration are used to set the LegendBase.Direction property.
For more information, refer to Legends.
Example
This example demonstrates how to access a chart’s Legend and customize its appearance at runtime.
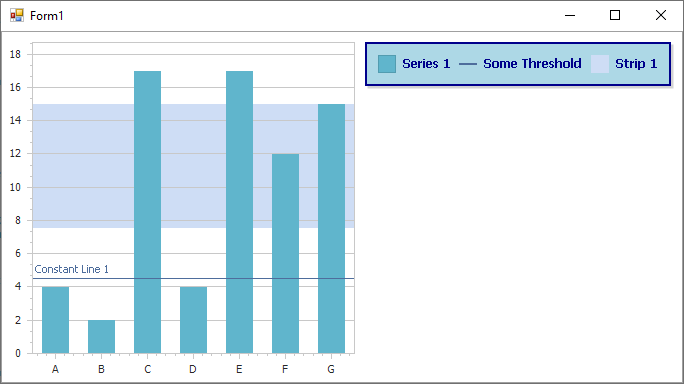
To specify whether series, indicators, Constant Lines, and Strips should be shown in the legend, set their SeriesBase.ShowInLegend, Indicator.ShowInLegend, ConstantLine.ShowInLegend, and Strip.ShowInLegend properties to true.
using System;
using System.Drawing;
using System.Windows.Forms;
using DevExpress.Drawing;
using DevExpress.XtraCharts;

namespace ChartLegend {
    public partial class Form1 : Form {
        public Form1() {
            InitializeComponent();
        }
        private void Form1_Load(object sender, EventArgs e) {
            // Create an empty chart.
            ChartControl chartControl1 = new ChartControl();

            // Create a series and add points to it.
            Series series1 = new Series("Series 1", ViewType.Bar);
            series1.Points.Add(new SeriesPoint("A", new double[] { 4 }));
            series1.Points.Add(new SeriesPoint("B", new double[] { 2 }));
            series1.Points.Add(new SeriesPoint("C", new double[] { 17 }));
            series1.Points.Add(new SeriesPoint("D", new double[] { 4 }));
            series1.Points.Add(new SeriesPoint("E", new double[] { 17 }));
            series1.Points.Add(new SeriesPoint("F", new double[] { 12 }));
            series1.Points.Add(new SeriesPoint("G", new double[] { 15 }));

            // Add the series to the chart.
            chartControl1.Series.Add(series1);

            // Create a constant line (optional).
            ConstantLine constantLine1 = new ConstantLine("Constant Line 1");
            ((XYDiagram)chartControl1.Diagram).AxisY.ConstantLines.Add(constantLine1);
            constantLine1.AxisValue = 4.5;

            // Create a strip (optional).
            Strip strip1 = new Strip("Strip 1");
            ((XYDiagram)chartControl1.Diagram).AxisY.Strips.Add(strip1);
            strip1.MaxLimit.AxisValue = 15;
            strip1.MinLimit.AxisValue = 7.5;

            // Customize the strip's and constant line's legend appearance.
            strip1.ShowInLegend = true;
            constantLine1.ShowInLegend = true;
            constantLine1.LegendText = "Some Threshold";

            // Display the chart control's legend.
            chartControl1.Legend.Visibility = DevExpress.Utils.DefaultBoolean.True;

            // Define its horizontal and vertical alignment.
            chartControl1.Legend.AlignmentHorizontal = LegendAlignmentHorizontal.RightOutside;
            chartControl1.Legend.AlignmentVertical = LegendAlignmentVertical.Top;

            // Define the layout of items within the legend.
            chartControl1.Legend.Direction = LegendDirection.LeftToRight;
            chartControl1.Legend.EquallySpacedItems = true;
            chartControl1.Legend.HorizontalIndent = 4;
            chartControl1.Legend.VerticalIndent = 4;
            chartControl1.Legend.TextOffset = 4;

            // Define the limits for the legend to occupy the chart's space.
            chartControl1.Legend.MaxHorizontalPercentage = 50;
            chartControl1.Legend.MaxVerticalPercentage = 50;

            // Define the legend markers' options.
            chartControl1.Legend.MarkerVisible = true;
            chartControl1.Legend.MarkerSize = new Size(20, 20);

            // Customize the legend appearance.
            chartControl1.Legend.BackColor = Color.LightBlue;
            chartControl1.Legend.FillStyle.FillMode = FillMode.Empty;

            chartControl1.Legend.Border.Color = Color.DarkBlue;
            chartControl1.Legend.Border.Thickness = 2;
            chartControl1.Legend.Border.Visibility = DevExpress.Utils.DefaultBoolean.True;

            chartControl1.Legend.Shadow.Visible = true;
            chartControl1.Legend.Shadow.Color = Color.LightGray;
            chartControl1.Legend.Shadow.Size = 2;

            // Customize the legend text properties.
            chartControl1.Legend.EnableAntialiasing = DevExpress.Utils.DefaultBoolean.False;
            chartControl1.Legend.DXFont = new DXFont("Tahoma", 9, DXFontStyle.Bold);
            chartControl1.Legend.TextColor = Color.DarkBlue;

            // Add the chart to the form.
            chartControl1.Dock = DockStyle.Fill;
            this.Controls.Add(chartControl1);
        }
    }
}