HeatmapLabel.Visible Property
Specifies whether heatmap labels are visible.
Namespace: DevExpress.XtraCharts.Heatmap
Assembly: DevExpress.XtraCharts.v21.2.dll
NuGet Package: DevExpress.Charts
Declaration
[XtraChartsLocalizableCategory(XtraChartsCategory.Appearance)]
public bool Visible { get; set; }Property Value
| Type | Description |
|---|---|
| Boolean | true if labels are visible; otherwise, false. |
Example
The following example shows how to configure heatmap cell label settings such as format, font, color, and so on.
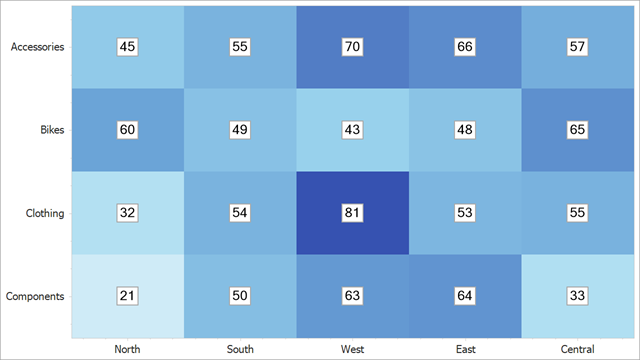
Use the HeatmapControl.Label property to access label settings:
using DevExpress.XtraCharts;
using DevExpress.XtraCharts.Heatmap;
using System;
using System.Drawing;
using System.Windows.Forms;

namespace HeatmapMatrixAdapterSample {
    public partial class Form1 : Form {
        public Form1() {
            InitializeComponent();

            HeatmapControl heatmap = new HeatmapControl();
            this.Controls.Add(heatmap);

            heatmap.Dock = DockStyle.Fill;

            HeatmapMatrixAdapter dataAdapter = new HeatmapMatrixAdapter();
            dataAdapter.XArguments = new string[] { "North", "South", "West", "East", "Central" };
            dataAdapter.YArguments = new string[] { "Components", "Clothing", "Bikes", "Accessories" };
            dataAdapter.Values = new double[,] {
                { 21.3, 50.1, 63.2, 64.4, 33.4 },
                { 32.3, 54.4, 81.3, 53.4, 54.9 },
                { 60.3, 49.1, 42.6, 48.4, 65.4 },
                { 45.3, 54.7, 70.3, 66.4, 56.6 }
            };
            heatmap.DataAdapter = dataAdapter;
            Palette palette = new Palette("Custom") { Color.White, Color.SkyBlue, Color.DarkBlue };
            RangeColorProvider colorProvider = new RangeColorProvider() { Palette = palette, ApproximateColors = true };
            colorProvider.RangeStops.Add(new Unit(0, UnitType.Percentage));
            colorProvider.RangeStops.Add(new Unit(20, UnitType.Absolute));
            colorProvider.RangeStops.Add(new Unit(40, UnitType.Absolute));
            colorProvider.RangeStops.Add(new Unit(60, UnitType.Absolute));
            colorProvider.RangeStops.Add(new Unit(90, UnitType.Absolute));
            colorProvider.RangeStops.Add(new Unit(1, UnitType.Percentage));
            dataAdapter.ColorProvider = colorProvider;

            HeatmapLabel label = heatmap.Label;
            label.Visible = true;
            label.Pattern = "{V:f0}";
            label.BackColor = Color.White;
            label.Color = Color.Black;
            label.Font = new Font("SegoeUI", 10);
            label.TextOrientation = DevExpress.XtraCharts.Heatmap.TextOrientation.Horizontal;
            label.Border.Visibility = DevExpress.Utils.DefaultBoolean.True;
            label.Border.Color = Color.DarkGray;
            label.Border.Thickness = 2;
        }
    }
}
Related GitHub Examples
The following code snippets (auto-collected from DevExpress Examples) contain references to the Visible property.
Note
The algorithm used to collect these code examples remains a work in progress. Accordingly, the links and snippets below may produce inaccurate results. If you encounter an issue with code examples below, please use the feedback form on this page to report the issue.