FunnelSeriesLabel.Position Property
Gets or sets the position of labels relative to each other and the funnel diagram.
Namespace: DevExpress.XtraCharts
Assembly: DevExpress.XtraCharts.v18.2.dll
Declaration
[XtraChartsLocalizableCategory(XtraChartsCategory.Behavior)]
[XtraSerializableProperty]
public FunnelSeriesLabelPosition Position { get; set; }Property Value
| Type | Description |
|---|---|
| FunnelSeriesLabelPosition | A FunnelSeriesLabelPosition enumeration value determining the position of a label against the corresponding series point. |
Available values:
| Name | Description |
|---|---|
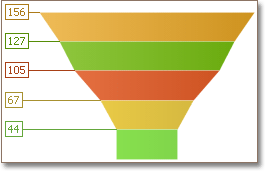
| LeftColumn | The labels are organized into a straight column on the left of the funnel series points.
|
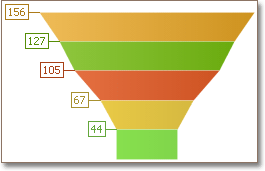
| Left | The labels are displayed on the left of the funnel series points.
|
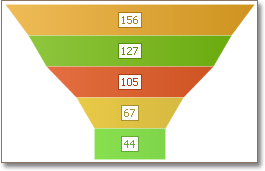
| Center | The labels are displayed in the center of the funnel series points.
|
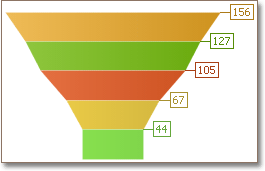
| Right | The labels are displayed on the right of the funnel series points.
|
| RightColumn | The labels are organized into a straight column on the right of the funnel series points.
|
Remarks
Refer to the FunnelSeriesLabelPosition enumeration’s description for a list of the available label positions.
For more information, refer to Series Points.
Example
The following example demonstrates how to create a ChartControl with a series of the FunnelSeriesView type, and add this chart to a form at runtime. Before proceeding with this example, create a Windows Forms Application in Visual Studio, and add all required assemblies to the References list of your project.
Then, add the following code to the Form.Load event handler.
using DevExpress.XtraCharts;
// ...
private void Form1_Load(object sender, EventArgs e) {
// Create a new chart.
ChartControl funnelChart = new ChartControl();
// Create a funnel series.
Series series1 = new Series("A Funnel Series", ViewType.Funnel);
// Add points to the series.
series1.Points.Add(new SeriesPoint("A", 48.5));
series1.Points.Add(new SeriesPoint("B", 29.6));
series1.Points.Add(new SeriesPoint("C", 17.1));
series1.Points.Add(new SeriesPoint("D", 13.3));
series1.Points.Add(new SeriesPoint("E", 11.6));
// Add the series to the chart.
funnelChart.Series.Add(series1);
// Adjust the view-type specific properties of the series.
FunnelSeriesView myView = (FunnelSeriesView)series1.View;
myView.Titles.Add(new SeriesTitle());
myView.Titles[0].Text = series1.Name;
myView.HeightToWidthRatioAuto = false;
myView.HeightToWidthRatio = 1.5;
myView.PointDistance = 10;
// Adjust the point options of the series.
FunnelPointOptions myPointOptions = (FunnelPointOptions)series1.PointOptions;
myPointOptions.PointView = PointView.ArgumentAndValues;
myPointOptions.PercentOptions.ValueAsPercent = true;
myPointOptions.ValueNumericOptions.Format = NumericFormat.Percent;
myPointOptions.ValueNumericOptions.Precision = 0;
// Specify the series labels position.
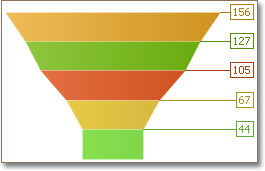
((FunnelSeriesLabel)series1.Label).Position = FunnelSeriesLabelPosition.RightColumn;
// Hide the legend (if necessary).
funnelChart.Legend.Visible = false;
// Add the chart to the form.
funnelChart.Dock = DockStyle.Fill;
this.Controls.Add(funnelChart);
}