FinancialSeriesViewBase.LevelLineLength Property
Gets or sets a value specifying the length (in axis units) of the level line in financial series.
Namespace: DevExpress.XtraCharts
Assembly: DevExpress.XtraCharts.v18.2.dll
Declaration
[XtraSerializableProperty]
[XtraChartsLocalizableCategory(XtraChartsCategory.Layout)]
public double LevelLineLength { get; set; }Property Value
| Type | Description |
|---|---|
| Double | A Double value which represents the length of a level line in axis units, where an axis unit is the distance between two major values on the axis. This value should be greater than or equal to 0. |
Remarks
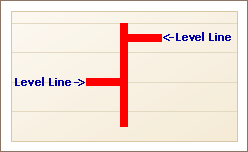
The LevelLineLength property specifies the length of a level line in all Financial Series (Stock Series and Candle Stick Series). Since this property’s value is measured as a fraction of axis units, this allows its length to be automatically resized when the size of a Chart is changed. For instance, if the LevelLineLength property is set to 0.5, then the length of every level line will always be equal to half the range between two major values on the axis.
For instance, these are the level lines in the Stock Series view.
Example
This example demonstrates how to create a ChartControl with a series of the StockSeriesView type, and add this chart to a form at runtime. Before proceeding with this example, first create a Windows Forms Application in Visual Studio, and include all necessary assemblies to the References list of your project.
Then, add the following code to the Form.Load event handler.
Note that you can exclude non-working days (weekends and holidays) from an axis range, via the AxisBase.WorkdaysOnly and AxisBase.WorkdaysOptions properties. And, to learn which instruments for financial analysis are available in XtraCharts, refer to Indicators.
Note
A complete sample project is available at https://github.com/DevExpress-Examples/how-to-create-a-stock-chart-e1215
using System;
using System.Windows.Forms;
using DevExpress.XtraCharts;
// ...
        private void Form1_Load(object sender, EventArgs e) {
            // Create a new chart.
            ChartControl stockChart = new ChartControl();

            // Create a stock series.
            Series series1 = new Series("Series 1", ViewType.Stock);

            // Specify the date-time argument scale type for the series,
            // as it is qualitative, by default.
            series1.ArgumentScaleType = ScaleType.DateTime;

            // Add points to it.
            series1.Points.Add(new SeriesPoint(new DateTime(2017, 3, 1),
                new object[] { 24.00, 25.00, 25.00, 24.875 }));
            series1.Points.Add(new SeriesPoint(new DateTime(2017, 3, 2),
                new object[] { 23.625, 25.125, 24.00, 24.875 }));
            series1.Points.Add(new SeriesPoint(new DateTime(2017, 3, 3),
                new object[] { 26.25, 28.25, 26.75, 27.00 }));
            series1.Points.Add(new SeriesPoint(new DateTime(2017, 3, 6),
                new object[] { 26.50, 27.875, 26.875, 27.25 }));
            series1.Points.Add(new SeriesPoint(new DateTime(2017, 3, 7),
                new object[] { 26.375, 27.50, 27.375, 26.75 }));
            series1.Points.Add(new SeriesPoint(new DateTime(2017, 3, 8),
                new object[] { 25.75, 26.875, 26.75, 26.00 }));
            series1.Points.Add(new SeriesPoint(new DateTime(2017, 3, 9),
                new object[] { 25.75, 26.75, 26.125, 26.25 }));
            series1.Points.Add(new SeriesPoint(new DateTime(2017, 3, 10),
                new object[] { 25.75, 26.375, 26.375, 25.875 }));
            series1.Points.Add(new SeriesPoint(new DateTime(2017, 3, 13),
                new object[] { 24.875, 26.125, 26.00, 25.375 }));
            series1.Points.Add(new SeriesPoint(new DateTime(2017, 3, 14),
                new object[] { 25.125, 26.00, 25.625, 25.75 }));

            // Add the series to the chart.
            stockChart.Series.Add(series1);

            // Access the view-type-specific options of the series.
            StockSeriesView myView = (StockSeriesView)series1.View;

            myView.LineThickness = 2;
            myView.LevelLineLength = 0.25;

            // Specify the series reduction options.
            myView.ReductionOptions.ColorMode = ReductionColorMode.OpenToCloseValue;
            myView.ReductionOptions.Level = StockLevel.Close;
            myView.ReductionOptions.Visible = true;

            // Access the chart's diagram.
            XYDiagram diagram = ((XYDiagram)stockChart.Diagram);

            // Access the type-specific options of the diagram.
            diagram.AxisY.WholeRange.MinValue = 22;

            // Exclude weekends from the X-axis range,
            // to avoid gaps in the chart's data.
            diagram.AxisX.DateTimeScaleOptions.WorkdaysOnly = true;

            // Hide the legend (if necessary).
            stockChart.Legend.Visibility = DevExpress.Utils.DefaultBoolean.False;

            // Add a title to the chart (if necessary).
            stockChart.Titles.Add(new ChartTitle());
            stockChart.Titles[0].Text = "Stock Chart";

            // Add the chart to the form.
            stockChart.Dock = DockStyle.Fill;
            this.Controls.Add(stockChart);
        }