Diagram3D.ZoomPercent Property
Gets or sets the magnification amount applied to the chart, as a percentage.
Namespace: DevExpress.XtraCharts
Assembly: DevExpress.XtraCharts.v18.2.dll
Declaration
[XtraChartsLocalizableCategory(XtraChartsCategory.Behavior)]
[XtraSerializableProperty]
public int ZoomPercent { get; set; }Property Value
| Type | Description |
|---|---|
| Int32 | A Double value that specifies the zooming percentage. Should be within the range 1;500. |
Remarks
Note
Note that too large a value for this property will cause the series to expand out of the diagram. In this case, it may be required to allow your end users to zoom in and out of the diagram manually, to see the entire series. To do this, enable the Diagram3D.RuntimeZooming property.
The following images demonstrate the ZoomPercent property in action.
| ZoomPercent = 100 | ZoomPercent = 150 |
|---|---|
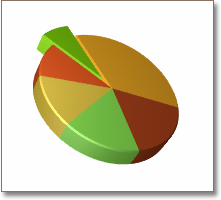 |
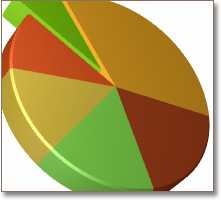 |
For more information, refer to Zooming and Scrolling (2D XY-Charts) and Zooming and Scrolling (3D Charts).
Example
The following example demonstrates how to create a ChartControl with a series of the Area3DSeriesView type, set its general properties, and add this chart to a form at runtime. Before proceeding with this example, first create a Windows Forms Application in Visual Studio, and include all necessary assemblies to the References list of your project.
Then, add the following code to the Form.Load event handler.
using System;
using System.Windows.Forms;
using DevExpress.XtraCharts;
// ...

private void Form1_Load(object sender, EventArgs e) {
    // Create a new chart.
    ChartControl areaChart3D = new ChartControl();

    // Add an area series to it.
    Series series1 = new Series("Series 1", ViewType.Area3D);

    // Add points to the series.
    series1.Points.Add(new SeriesPoint("A", 10));
    series1.Points.Add(new SeriesPoint("B", 2));
    series1.Points.Add(new SeriesPoint("C", 14));
    series1.Points.Add(new SeriesPoint("D", 7));

    // Add the series to the chart.
    areaChart3D.Series.Add(series1);

    // Customize the view-type-specific properties of the series.
    ((Area3DSeriesView)series1.View).AreaWidth = 5;

    // Access the diagram's options.
    ((XYDiagram3D)areaChart3D.Diagram).ZoomPercent = 110;

    // Add a title to the chart and hide the legend.
    ChartTitle chartTitle1 = new ChartTitle();
    chartTitle1.Text = "3D Area Chart";
    areaChart3D.Titles.Add(chartTitle1);
    areaChart3D.Legend.Visible = false;

    // Add the chart to the form.
    areaChart3D.Dock = DockStyle.Fill;
    this.Controls.Add(areaChart3D);
}