DateTimeScaleOptions.GridAlignment Property
Gets or sets the date-time measure unit to which the beginning of an axis’ gridlines and labels should be aligned.
Namespace: DevExpress.XtraCharts
Assembly: DevExpress.XtraCharts.v21.2.dll
NuGet Package: DevExpress.Charts
Declaration
Property Value
| Type | Description |
|---|---|
| DateTimeGridAlignment | A DateTimeGridAlignment enumeration value that represents the measurement unit to which the beginning of an axis’s gridlines and labels should be aligned. |
Available values:
| Name | Description |
|---|---|
| Millisecond | Specifies a millisecond as the date-time unit to which axis gridlines should be aligned. |
| Second | Specifies a second as the date-time unit to which axis gridlines should be aligned. |
| Minute | Specifies a minute as the date-time unit to which axis gridlines should be aligned. |
| Hour | Specifies an hour as the date-time unit to which axis gridlines should be aligned. |
| Day | Specifies a day as the date-time unit to which axis gridlines should be aligned. |
| Week | Specifies a week as the date-time unit to which axis gridlines should be aligned. |
| Month | Specifies a month as the date-time unit to which axis gridlines should be aligned. |
| Quarter | Specifies a quarter of a year as the date-time unit to which axis gridlines should be aligned. |
| Year | Specifies a year as the date-time unit to which axis gridlines should be aligned. |
Property Paths
You can access this nested property as listed below:
| Object Type | Path to GridAlignment |
|---|---|
| AxisBase |
|
Remarks
This property is available when the SeriesBase.ArgumentScaleType or SeriesBase.ValueScaleType property is set to DateTime, and the ScaleOptionsBase.ScaleMode property is set to Manual.
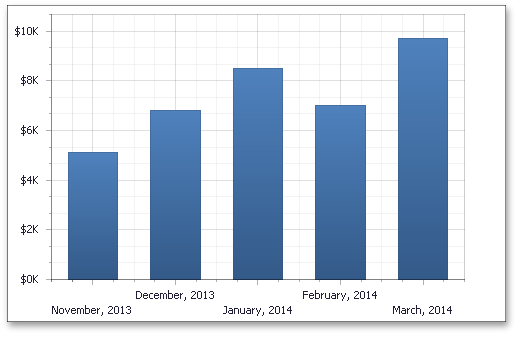
| GridAlignment = Month, MeasureUnit=Month | GridAlignment = Quarter, MeasureUnit=Month |
|---|---|
 |
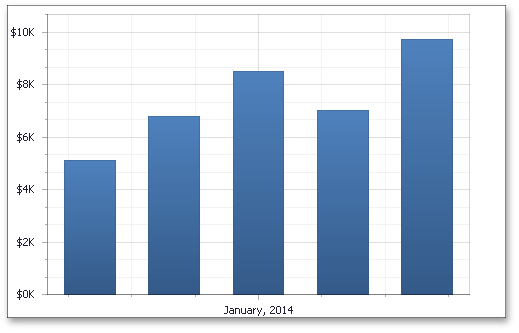 |
To maintain date-time values at different detail levels, use the DateTimeScaleOptions.MeasureUnit property.
Example
This example demonstrates how an axis’ date-time and numeric options can be customized, depending on the ScaleType defined for a series’ arguments and values.
Note
A complete sample project is available at https://github.com/DevExpress-Examples/how-to-customize-numerical-and-date-time-options-of-an-axis-e1361
using System;
using System.Windows.Forms;
using DevExpress.XtraCharts;
// ...

namespace FormatAxisLabels {
    public partial class Form1 : Form {
        public Form1() {
            InitializeComponent();
        }

        private void Form1_Load(object sender, EventArgs e) {
            // Create an empty chart.
            ChartControl chartControl1 = new ChartControl();

            // Create a bar series and add points to it.
            Series series1 = new Series("Series 1", ViewType.Bar);
            series1.Points.Add(new SeriesPoint(new DateTime(2009, 1, 1), new double[] { 26.25 }));
            series1.Points.Add(new SeriesPoint(new DateTime(2009, 2, 1), new double[] { 16.52 }));
            series1.Points.Add(new SeriesPoint(new DateTime(2009, 3, 1), new double[] { 22.21 }));
            series1.Points.Add(new SeriesPoint(new DateTime(2009, 4, 1), new double[] { 15.35 }));
            series1.Points.Add(new SeriesPoint(new DateTime(2009, 5, 1), new double[] { 24.15 }));

            // Add the series to the chart.
            chartControl1.Series.Add(series1);

            // Hide the legend (if necessary).
            chartControl1.Legend.Visibility = DevExpress.Utils.DefaultBoolean.False;

            // Set the scale type for the series' arguments and values.
            series1.ArgumentScaleType = ScaleType.DateTime;
            series1.ValueScaleType = ScaleType.Numerical;

            // Cast the chart's diagram to the XYDiagram type, to access its axes.
            XYDiagram diagram = chartControl1.Diagram as XYDiagram;

            // Define the date-time measurement unit, to which the beginning of
            // a diagram's gridlines and labels should be aligned.
            diagram.AxisX.DateTimeScaleOptions.GridAlignment = DateTimeGridAlignment.Day;

            // Define the detail level for date-time values.
            diagram.AxisX.DateTimeScaleOptions.MeasureUnit = DateTimeMeasureUnit.Month;

            // Define the custom date-time format (name of a month) for the axis labels.
            diagram.AxisX.Label.TextPattern = "{V:MMMM}";

            // Since the ValueScaleType of the chart's series is Numerical,
            // it is possible to customize the NumericOptions of Y-axis.
            diagram.AxisY.Label.TextPattern = "{V:C1}";

            // Add a title to the chart (if necessary).
            ChartTitle chartTitle1 = new ChartTitle();
            chartTitle1.Text = "Axis Scale Types";
            chartControl1.Titles.Add(chartTitle1);

            // Add the chart to the form.
            chartControl1.Dock = DockStyle.Fill;
            this.Controls.Add(chartControl1);
        }

    }
}
Related GitHub Examples
The following code snippet (auto-collected from DevExpress Examples) contains a reference to the GridAlignment property.
Note
The algorithm used to collect these code examples remains a work in progress. Accordingly, the links and snippets below may produce inaccurate results. If you encounter an issue with code examples below, please use the feedback form on this page to report the issue.