ChartRangeControlClientGridOptions.GridMode Property
Specifies the current grid mode of a chart range control client.
Namespace: DevExpress.XtraCharts
Assembly: DevExpress.XtraCharts.v18.2.dll
Declaration
Property Value
| Type | Description |
|---|---|
| ChartRangeControlClientGridMode | A ChartRangeControlClientGridMode enumeration value, which selects one of the modes. |
Available values:
Property Paths
You can access this nested property as listed below:
| Object Type | Path to GridMode |
|---|---|
| ChartRangeControlClientDateTimeOptions |
|
| ChartRangeControlClientNumericOptions |
|
| GanttDiagram |
|
| SwiftPlotDiagram |
|
| XYDiagram |
|
| XYDiagram2D |
|
Remarks
Use the GridMode property to define which grid mode of the chart range control client should be used: auto, chart grid or manual.
Note that if you defined one of the ChartRangeControlClientGridOptions.GridSpacing, ChartRangeControlClientGridOptions.GridOffset or ChartRangeControlClientDateTimeGridOptions.GridAlignment properties in the ChartRangeControlClientGridMode.Auto grid mode, this mode is changed to ChartRangeControlClientGridMode.Manual.
Example
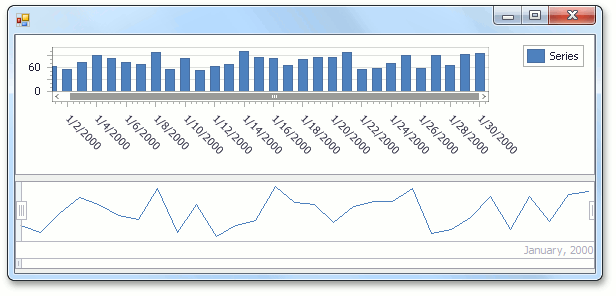
This example demonstrates how the grid lines and grid snapping of the chart within the range control’s viewport can be customized at runtime.
To access the client options of the chart inside the range control’s viewport, use the RangeControl.ClientOptions property. In this example, the chart control contains data with date-time arguments, so this property returns an object of the ChartRangeControlClientDateTimeOptions type.
To access the grid properties (e.g., ChartRangeControlClientGridOptions.SnapSpacing, ChartRangeControlClientDateTimeGridOptions.SnapAlignment, ChartRangeControlClientGridOptions.GridSpacing and ChartRangeControlClientDateTimeGridOptions.GridAlignment) of the chart range control client, access the ChartRangeControlClientDateTimeGridOptions object using the ChartRangeControlClientDateTimeOptions.RangeControlDateTimeGridOptions property.
Note
A complete sample project is available at https://github.com/DevExpress-Examples/how-to-customize-grid-lines-grid-snapping-of-the-chart-range-control-client-t129232
using System;
using System.Windows.Forms;
using DevExpress.XtraCharts;

namespace DateTimeChartRangeControlClient {
    public partial class Form1 : Form {

        const int daysForYear = 30;

        public Form1() {
            InitializeComponent();

            // Call the InitializeChart method.
            InitializeChart();

            // Specify a Chart control as the Range control client.
            rangeControl1.Client = chartControl1;

            // Access the date-time grid options of the chart range control client.
            var clientOptions = (ChartRangeControlClientDateTimeOptions)rangeControl1.ClientOptions;
            ChartRangeControlClientDateTimeGridOptions gridOptions = clientOptions.RangeControlDateTimeGridOptions;

            // Specify the manual grid mode of the chart range control client.
            gridOptions.GridMode = ChartRangeControlClientGridMode.Manual;

            // Customize snap and grid properties of the chart range control client.
            gridOptions.SnapOffset = 2;
            gridOptions.SnapSpacing = 7;
            gridOptions.SnapAlignment = DateTimeGridAlignment.Day;
            gridOptions.GridSpacing = 7;
            gridOptions.GridAlignment = DateTimeGridAlignment.Day;
            gridOptions.GridOffset = 1;

            // Format labels of the chart range control client.
            gridOptions.LabelFormat = "D";
        }

        void InitializeChart() {

            DateTime baseDate = new DateTime(2000, 1, 1);
            Random rnd = new Random();
            Series series = new Series("Series", ViewType.Bar);

            for (int dayCount = 0; dayCount < daysForYear; dayCount++) {
                DateTime argument = baseDate.AddDays(dayCount);
                double value = rnd.Next(50, 100);
                var seriesPoint = new SeriesPoint(argument, value);
                series.Points.Add(seriesPoint);
            }
            chartControl1.Series.Add(series);
        }
    }
}
Related GitHub Examples
The following code snippet (auto-collected from DevExpress Examples) contains a reference to the GridMode property.
Note
The algorithm used to collect these code examples remains a work in progress. Accordingly, the links and snippets below may produce inaccurate results. If you encounter an issue with code examples below, please use the feedback form on this page to report the issue.