AxisLabel.Angle Property
Gets or sets the rotation angle of axis labels in degrees.
Namespace: DevExpress.XtraCharts
Assembly: DevExpress.XtraCharts.v18.2.dll
Declaration
[XtraSerializableProperty]
[XtraChartsLocalizableCategory(XtraChartsCategory.Layout)]
public int Angle { get; set; }Property Value
| Type | Description |
|---|---|
| Int32 | An integer value that is a rotation angle in degrees. |
Remarks
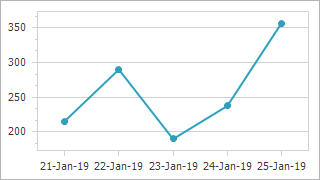
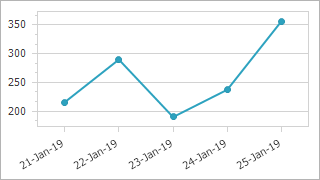
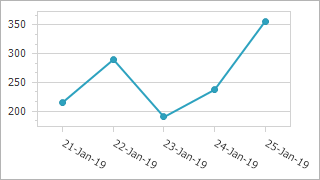
In Cartesian (2D XY Diagram, 3D XY Diagram and Gantt) charts, a rotation angle is counted clockwise from a horizontal line. The x-axis and y-axis labels can rotate. The following images show how the Angle property operates for the x-axis labels.
| 0 (Default) | -30 | 30 |
|---|---|---|
 |
 |
 |
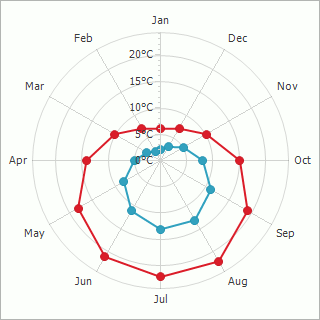
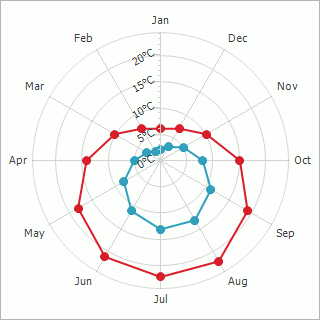
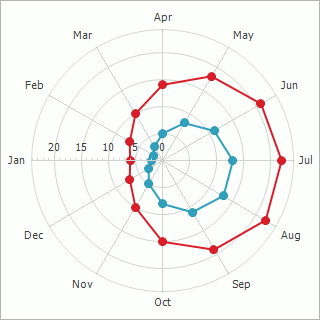
In Radar and Polar charts, a rotation angle is counted clockwise from the perpendicular to the axis. Only the y-axis labels can rotate. The following images demonstrate how the Angle property operates in Radar and Polar charts:
| 0 (Default) | -30 | 90 (RadarDiagram.StartAngleInDegrees = -90) |
|---|---|---|
 |
 |
 |
Example
The following example demonstrates how to create a ChartControl with two series of the OverlappedGanttSeriesView type, and add this chart to a form at runtime. Before proceeding with this example, first create a Windows Forms Application in Visual Studio, and include all necessary assemblies to the References list of your project.
Then, add the following code to the Form.Load event handler.
using System;
using System.Windows.Forms;
using DevExpress.XtraCharts;
// ...
private void Form1_Load(object sender, EventArgs e) {
// Create a new chart.
ChartControl overlappedGanttChart = new ChartControl();
// Create two Gantt series.
Series series1 = new Series("Planned", ViewType.Gantt);
Series series2 = new Series("Completed", ViewType.Gantt);
// Set the date-time values scale type for both series,
// as it is qualitative, by default.
series1.ValueScaleType = ScaleType.DateTime;
series2.ValueScaleType = ScaleType.DateTime;
// Add points to them.
series1.Points.Add(new SeriesPoint("Market analysis", new DateTime[] {
new DateTime(2006, 8, 16), new DateTime(2006, 8, 23) }));
series1.Points.Add(new SeriesPoint("Feature planning", new DateTime[] {
new DateTime(2006, 8, 23), new DateTime(2006, 8, 26) }));
series1.Points.Add(new SeriesPoint("Implementation", new DateTime[] {
new DateTime(2006, 8, 26), new DateTime(2006, 9, 26) }));
series1.Points.Add(new SeriesPoint("Testing & bug fixing", new DateTime[] {
new DateTime(2006, 9, 26), new DateTime(2006, 10, 10) }));
series2.Points.Add(new SeriesPoint("Market analysis", new DateTime[] {
new DateTime(2006, 8, 16), new DateTime(2006, 8, 23) }));
series2.Points.Add(new SeriesPoint("Feature planning", new DateTime[] {
new DateTime(2006, 8, 23), new DateTime(2006, 8, 26) }));
series2.Points.Add(new SeriesPoint("Implementation", new DateTime[] {
new DateTime(2006, 8, 26), new DateTime(2006, 9, 10) }));
// Add both series to the chart.
overlappedGanttChart.Series.AddRange(new Series[] { series1, series2 });
// Access the view-type-specific options of the series.
((GanttSeriesView)series1.View).BarWidth = 0.6;
((GanttSeriesView)series2.View).BarWidth = 0.3;
// Access the type-specific options of the diagram.
GanttDiagram myDiagram = (GanttDiagram)overlappedGanttChart.Diagram;
myDiagram.AxisY.Interlaced = true;
myDiagram.AxisY.GridSpacing = 10;
myDiagram.AxisY.Label.Angle = -30;
myDiagram.AxisY.DateTimeOptions.Format = DateTimeFormat.MonthAndDay;
// Add task links for the first Gantt series.
((GanttSeriesView)series1.View).LinkOptions.ArrowHeight = 7;
((GanttSeriesView)series1.View).LinkOptions.ArrowWidth = 11;
for (int i = 1; i < series1.Points.Count; i++) {
series1.Points[i].Relations.Add(series1.Points[i - 1]);
}
// Add a progress line.
ConstantLine progress =
new ConstantLine("Current progress", new DateTime(2006, 9, 10));
progress.ShowInLegend = false;
progress.Title.Alignment = ConstantLineTitleAlignment.Far;
myDiagram.AxisY.ConstantLines.Add(progress);
// Adjust the legend.
overlappedGanttChart.Legend.AlignmentHorizontal =
LegendAlignmentHorizontal.Right;
// Add a title to the chart (if necessary).
overlappedGanttChart.Titles.Add(new ChartTitle());
overlappedGanttChart.Titles[0].Text = "R&D Schedule";
// Add the chart to the form.
overlappedGanttChart.Dock = DockStyle.Fill;
this.Controls.Add(overlappedGanttChart);
}
Related GitHub Examples
The following code snippets (auto-collected from DevExpress Examples) contain references to the Angle property.
Note
The algorithm used to collect these code examples remains a work in progress. Accordingly, the links and snippets below may produce inaccurate results. If you encounter an issue with code examples below, please use the feedback form on this page to report the issue.