Annotation.ShapeKind Property
Specifies the shape kind of the annotation.
Namespace: DevExpress.XtraCharts
Assembly: DevExpress.XtraCharts.v23.2.dll
NuGet Package: DevExpress.Charts
Declaration
[XtraChartsLocalizableCategory(XtraChartsCategory.Appearance)]
public ShapeKind ShapeKind { get; set; }Property Value
| Type | Description |
|---|---|
| ShapeKind | A ShapeKind enumeration value representing the annotation shape kind. |
Available values:
| Name | Description |
|---|---|
| Rectangle | Represents the rectangle annotation shape kind.
|
| RoundedRectangle | Represents the rounded rectangle annotation shape kind.
|
| Ellipse | Represents the ellipse annotation shape kind.
|
Remarks
Use the ShapeKind property, to specify a shape which an annotation should have.
| ShapeKind = Ellipse | ShapeKind = Rectangle | ShapeKind = RoundedRectangle |
|---|---|---|
 |
 |
 |
When the ShapeKind.RoundedRectangle is specified, you can adjust its fillet amount via the Annotation.ShapeFillet property.
For more information, refer to Annotations.
Example
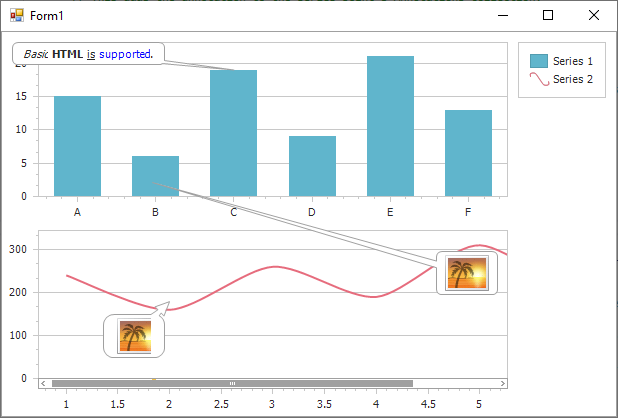
The following example demonstrates how to create text and image annotations and anchor them to a chart, its pane, and a series point.
#region #usings
using System;
using System.Drawing;
using System.IO;
using System.Windows.Forms;
using DevExpress.Drawing;
using DevExpress.XtraCharts;
// ...
#endregion #usings

namespace AnnotationsSample {
    public partial class Form1 : Form {
        public Form1() {
            InitializeComponent();
        }

        #region #generalcode
        private void Form1_Load(object sender, EventArgs e) {
            // Add a text annotation to the chart control's repository.
            chartControl1.AnnotationRepository.Add(new TextAnnotation("Annotation 1"));

            // And, assign a series point to the annotation's AnchorPoint property.
            // This adds the annotation to the series point's Annotations collection.
            chartControl1.AnnotationRepository[0].AnchorPoint =
                new SeriesPointAnchorPoint(chartControl1.Series[0].Points[2]);

            // Now, create an image annotation, and add it to the chart's collection.
            chartControl1.Annotations.AddImageAnnotation("Annotation 2",
                DXImage.FromStream(new FileStream(@"...\...\image.png", FileMode.Open, FileAccess.Read, FileShare.Read)));

            // Define the X and Y absolute coordinates for the annotation, in pixels.
            ((ChartAnchorPoint)chartControl1.Annotations[0].AnchorPoint).X = 150;
            ((ChartAnchorPoint)chartControl1.Annotations[0].AnchorPoint).Y = 150;

            // Obtain the additional pane from the diagram's collection.
            XYDiagramPaneBase myPane = ((XYDiagram)chartControl1.Diagram).Panes[0];

            // And, position the chart's annotation in this pane's right top corner;
            ((FreePosition)chartControl1.Annotations[0].ShapePosition).DockTarget = myPane;
            ((FreePosition)chartControl1.Annotations[0].ShapePosition).DockCorner = DockCorner.RightTop;

            // Another annotation is now being added to the collection of this pane.
            myPane.Annotations.AddImageAnnotation("Annotation 3",
                DXImage.FromStream(new FileStream(@"...\...\image.png", FileMode.Open, FileAccess.Read, FileShare.Read)));

            // Define its axis coordinates (in units appropriate for the scale type of the axes).
            ((PaneAnchorPoint)myPane.Annotations[0].AnchorPoint).AxisXCoordinate.AxisValue = 2;
            ((PaneAnchorPoint)myPane.Annotations[0].AnchorPoint).AxisYCoordinate.AxisValue = 180;

            // Position the annotation in relation to its anchor point.
            ((RelativePosition)myPane.Annotations[0].ShapePosition).Angle = -135;
            ((RelativePosition)myPane.Annotations[0].ShapePosition).ConnectorLength = 50;

            // You can get an annotation either via the collection of the element to which it is anchored,
            // or centrally, via the chart control's repository (e.g. by its name).
            TextAnnotation myTextAnnotation =
                (TextAnnotation)chartControl1.AnnotationRepository.GetElementByName("Annotation 1");
            ImageAnnotation myImageAnnotation =
                (ImageAnnotation)chartControl1.AnnotationRepository.GetElementByName("Annotation 3");

            // Define the text for the text annotation.
            myTextAnnotation.Text = "<i>Basic</i> <b>HTML</b> <u>is</u> <color=blue>supported</color>.";

            // Enable the interactive positioning for the image annotation.
            myImageAnnotation.RuntimeMoving = true;
            myImageAnnotation.RuntimeAnchoring = true;
            myImageAnnotation.RuntimeResizing = true;
            myImageAnnotation.RuntimeRotation = true;

            // Specify image annotation size mode.
            myImageAnnotation.SizeMode = ChartImageSizeMode.Tile;

            // And, adjust image annotation appearance options.
            myImageAnnotation.ShapeKind = ShapeKind.RoundedRectangle;
            myImageAnnotation.ShapeFillet = 10;
            myImageAnnotation.ConnectorStyle = AnnotationConnectorStyle.Arrow;
        }
        #endregion #generalcode

    }
}
Related GitHub Examples
The following code snippet (auto-collected from DevExpress Examples) contains a reference to the ShapeKind property.
Note
The algorithm used to collect these code examples remains a work in progress. Accordingly, the links and snippets below may produce inaccurate results. If you encounter an issue with code examples below, please use the feedback form on this page to report the issue.