Intermediate Level Aggregations
- 2 minutes to read
The Optimized calculation engine introduces a new aggregate function not available in Legacy and LegacyOptimized modes - the aggr function.
Tip
Use the PivotGridOptionsData.DataProcessingEngine property to enable the Optimized engine.
The aggr function uses the summary function to calculate values for data obtained from the first specified data source column, group data by the next specified columns, and calculate group summaries.
The aggr function can be nested, and you can summarize aggregated data in a single expression.
The aggr function has the following syntax:
aggr(summaryExpression, column1, column2, ...)
The first argument is a summary expression calculated against a data source column, followed by a set of data columns whose values are grouped to calculate summaries for the first argument.
Note
A calculated field that contains the aggr function is not displayed in the underlying data.
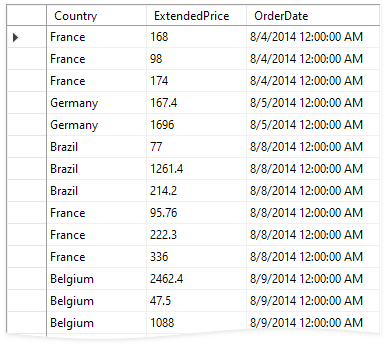
For example, the data below is Northwind orders for several years:
To show the percentage of sales in the country with the highest sales:
Create the SalesByYearByCountry field and calculate its value with the following expression:
aggr(Sum([ExtendedPrice]), GetYear([OrderDate]), [Country])Add the SalesByYearByCountry field to the Pivot Control’s Data area area.
Add one more field that uses ExpressionBinding with the new expression:
Sum([ExtendedPrice]) / Max(aggr( Max([SalesByYearByCountry]), GetYear([OrderDate])))- Add the created SalesByYearByCountry field to the Data area and set the summary type to “Max”.
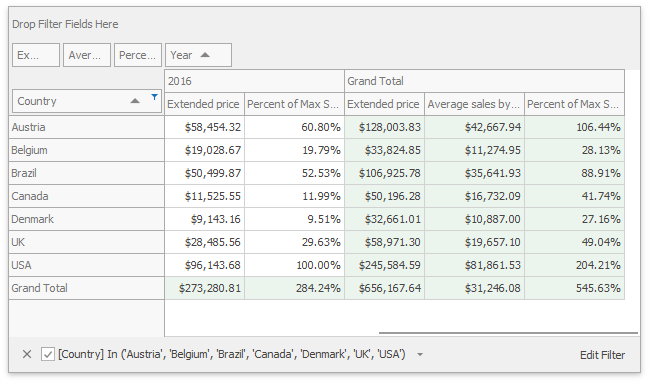
The following picture illustrates the resulting Pivot Grid with Average sales by year and Percent of Max sales by year fields:
Note
You can find this example and other examples in our Demo Center: Code Examples - Intermediate Level Aggregations (Optimized Mode) - Average sales by Year module in the XtraPivotGrid MainDemo