Profiling
CodeRush Classic enables you to measure the time taken by an operation and the amount of memory allocated during execution. The Profiling options page enables you to specify the operations that should be profiled and choose whether to show profiling results in the Message log or save them to disk.
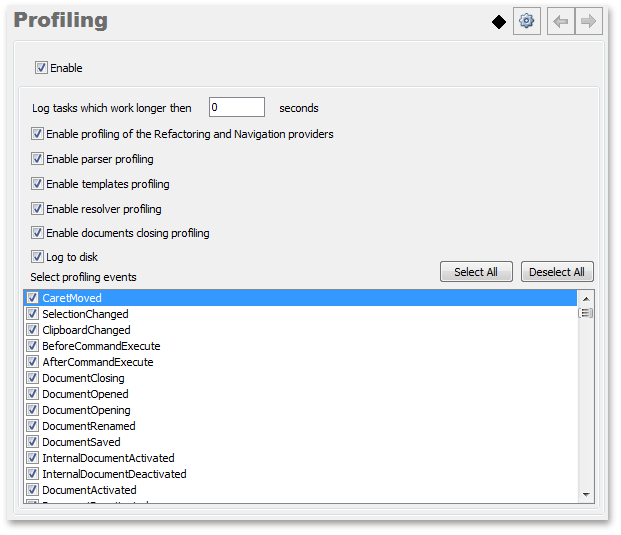
The options page includes the following options:
Enable
Enables or disables profiling.
Log tasks that work longer then X seconds
Specifies the minimum execution time of a profiled operation to save it to the profiler log.
Enable profiling of the Refactoring and Navigation providers, Enable parser profiling, Enable templates profiling, Enable resolver profiling, and Enable documents closing profiling
These options specify what CodeRush Classic operations should be profiled.
Log to disk
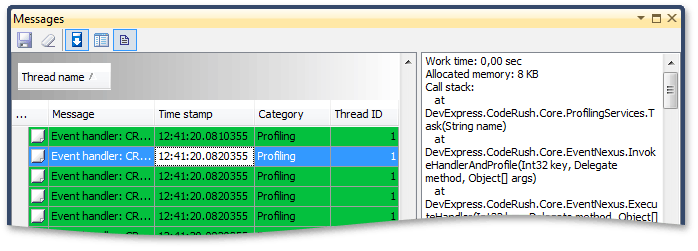
If the option is checked, the profiler messages are saved to the %Settings%/Log folder on the disk (the profiler log file name is “DXCore Profiling - [DATE] - [TIME].dxlog“). Otherwise, profiler messages are shown in the Messages window.
Select profiling events
Specifies the list of events to profile.
Note
This product is designed for outdated versions of Visual Studio. Although Visual Studio 2015 is supported, consider using the Code