DxChartRangeBarSeries<T, TArgument, TValue>.BarPadding Property
Specifies the padding between bars in bar groups, as a percentage.
Namespace: DevExpress.Blazor
Assembly: DevExpress.Blazor.v22.1.dll
NuGet Package: DevExpress.Blazor
Declaration
[DefaultValue(null)]
[Parameter]
public double? BarPadding { get; set; }
Property Value
| Type | Default | Description |
|---|---|---|
| Nullable<Double> | null | A value from 0 to 1. 0 - no padding is added; 1 - the bar has the minimum possible width. |
Remarks
The BarPadding property allows you to specify the bar padding of an individual series, as a percentage. Specify the series’s BarWidth and chart’s BarGroupWidth properties to set bar width and bar group width in pixels. The BarWidth and BarGroupWidth properties have a priority over the BarPadding property.
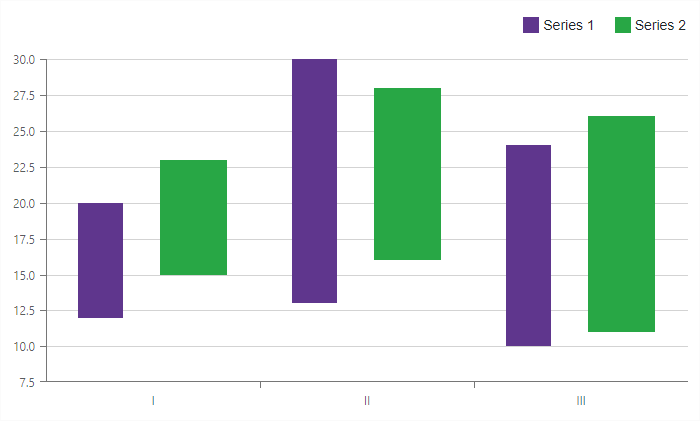
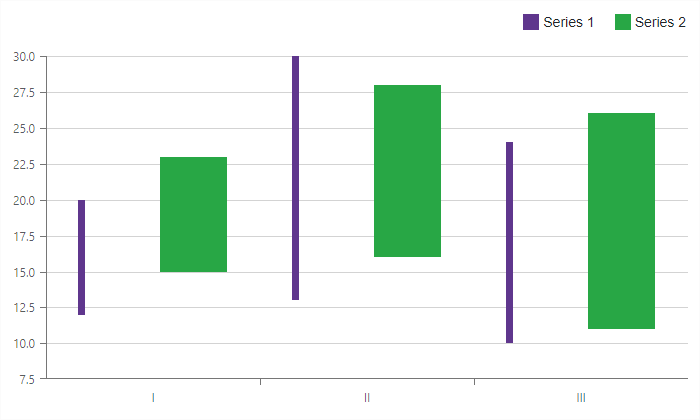
The images below show how BarPadding property values set for the Series 1 series affect its bars:
| BarPadding = 0.4 | BarPadding = 0.9 |
|---|---|
 |
 |
The following code specifies bar padding as 0.4 (40% of the maximum bar width), and consequently sets the bar width as 0.6 (60% of the maximum bar width):
@page "/"
@using System.Drawing

<DxChart @ref="@chart"
         Data="@dataPoints"
         Width=700 Height=400
         BarGroupPadding = "0.3">
    <DxChartRangeBarSeries ArgumentField="@((DataPoint i) => i.Arg)"
                           StartValueField="@((DataPoint i) => i.Value1)"
                           EndValueField="@((DataPoint i) => i.Value2)"
                           Name="Series 1"
                           BarPadding="0.4" />
    <DxChartRangeBarSeries ArgumentField="@((DataPoint i) => i.Arg)"
                           StartValueField="@((DataPoint i) => i.Value3)"
                           EndValueField="@((DataPoint i) => i.Value4)"
                           Name="Series 2" />
    <DxChartLegend Orientation="Orientation.Horizontal"
                   HorizontalAlignment="HorizontalAlignment.Right"
                   Position="RelativePosition.Outside" />
</DxChart>
Bar Padding in Multi-Series Charts
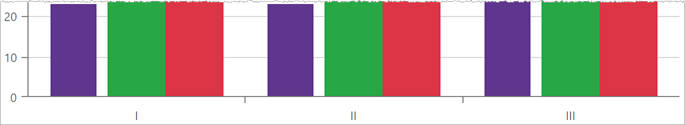
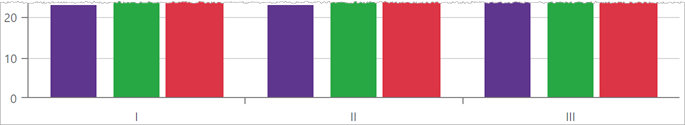
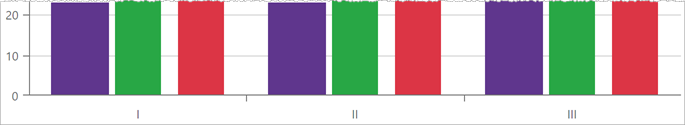
The following images show multiple bar series with different BarPadding values. The BarPadding property adds only the right padding for the first bar in a bar group; for the last bar in bar groups – the left padding. For other bars, the BarPadding property value is split evenly between the left and right padding values.
| Settings | Resulting Chart |
|---|---|
| series1.BarPadding=0.2 series2.BarPadding=0 series3.BarPadding=0 |
 |
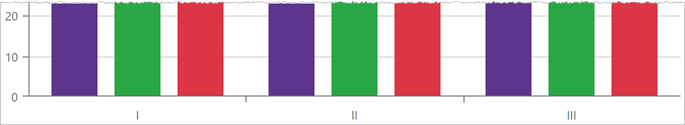
| series1.BarPadding=0.2 series2.BarPadding=0.2 series3.BarPadding=0 |
 |
| series1.BarPadding=0 series2.BarPadding=0.2 series3.BarPadding=0.2 |
 |
| series1.BarPadding=0.2 series2.BarPadding=0.2 series3.BarPadding=0.2 |
 |
Bar Padding and Bar Group Padding
In multi-series charts, you can use the BarGroupPadding property to configure left and right padding values for bar groups.
The following images show a chart with different BarPadding and BarGroupPadding property values:
| Settings | Resulting Chart |
|---|---|
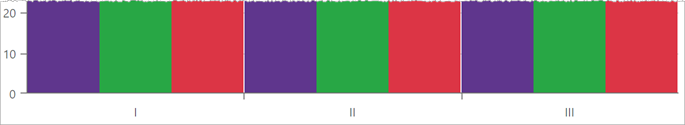
| BarGroupPadding=0 BarPadding=0 (for each series) |
 |
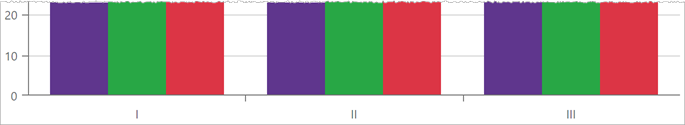
| BarGroupPadding=0.2 BarPadding=0 (for each series) |
 |
| BarGroupPadding=0.2 BarPadding=0.2 (for each series) |
|