Charts
- 2 minutes to read
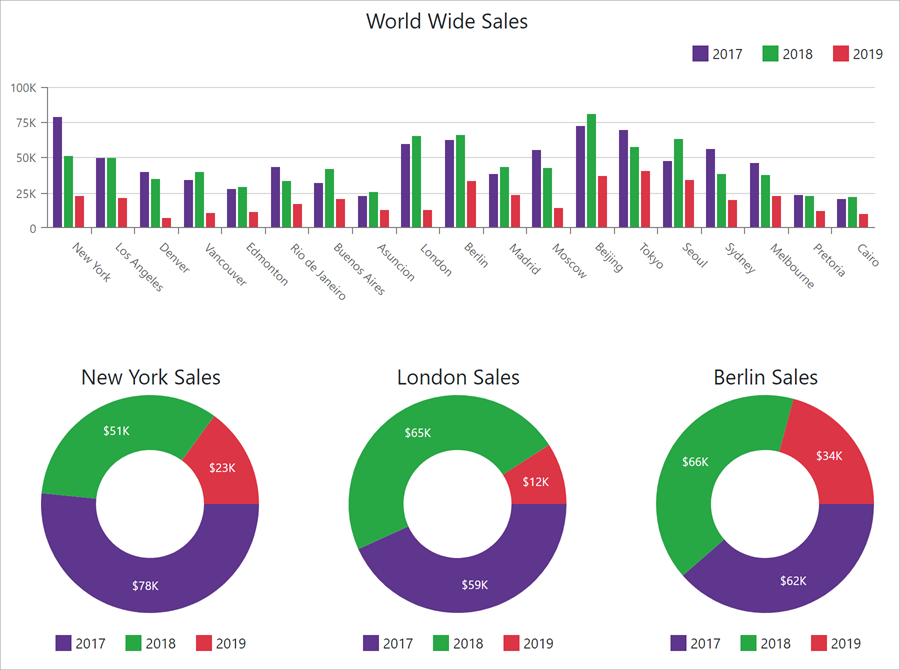
DevExpress Charts for Blazor help you transform data to its most appropriate, concise, and readable visual representation. Our Charts Suite ships with the following components:
<DxChart> – Allows you to display Cartesian charts such as bars, lines, financial OHLC views, and much more.
<DxPieChart> – Allows you to visualize your data as pies and doughnuts.
Features
Chart
- Bind to Data
- 25 Chart Types
- Axes
- Data Labels
- Legend
- Chart Titles
- Tooltips
- Multiple Panes
- Zoom and Pan
- Scale Breaks
- Constant Lines
- Visualize Pivot Grid Data
Pie Chart
Get Started
Create a Chart
Create a Pie Chart
Online Demos
DevExpress Blazor components ship with online feature-based demos. Follow the links below to try our Blazor Chart demos.
Troubleshooting
If a Blazor application throws unexpected exceptions, refer to the following help topic: Troubleshooting.