BootstrapChartCandleStickSeries Class
Stores settings supported by a series of the CandleStick type.
Namespace: DevExpress.Web.Bootstrap
Assembly: DevExpress.Web.Bootstrap.v19.1.dll
Declaration
Remarks
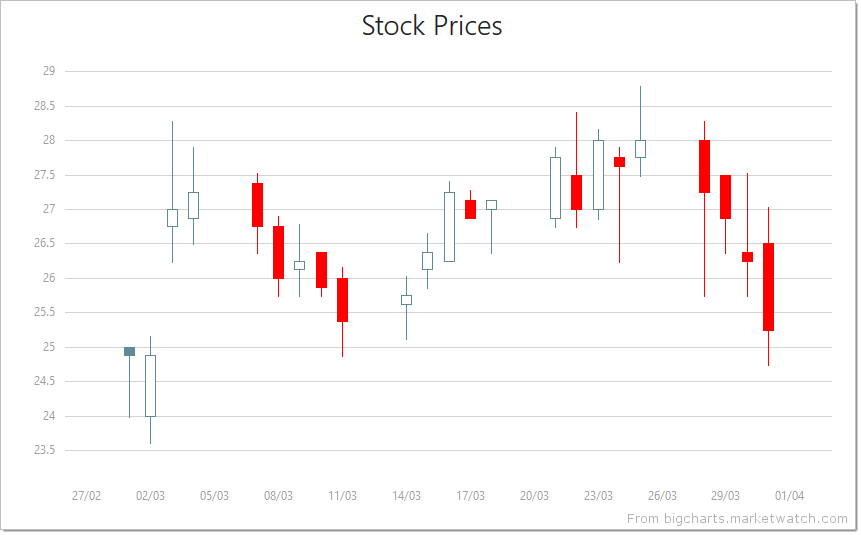
The CandleStick series type is used to show the variation in the price of stock over the course of a day. Each point consists of a rectangle (body), whose bottom and top values correspond to the open and close prices, and a vertical line (shadow, wick or tail), whose bottom and top values correspond to the low and high prices. If the stock closes higher than its opening price, the body is hollow. And if the stock closes lower than its opening price, the body is filled.
Inheritance
Object
StateManager
CollectionItem
DevExpress.Web.Bootstrap.Internal.JsonCollectionItem
BootstrapChartCommonSeriesBase
BootstrapCoordinateSystemChartSeries
BootstrapChartSeriesBase
BootstrapChartFinancialSeriesBase
BootstrapChartCandleStickSeries
See Also