BootstrapChart.SeriesCollection Property
Specifies options for Chart widget series.
Namespace: DevExpress.Web.Bootstrap
Assembly: DevExpress.Web.Bootstrap.v19.1.dll
Declaration
[PersistenceMode(PersistenceMode.InnerProperty)]
public BootstrapChartSeriesCollection SeriesCollection { get; }Property Value
| Type | Description |
|---|---|
| BootstrapChartSeriesCollection | An object of the BootstrapChartSeriesCollection class. |
Remarks
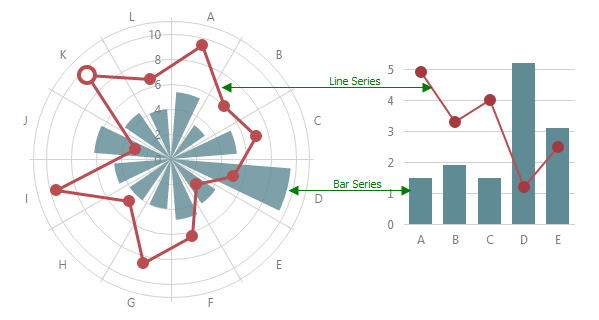
A series represents a grouping of related data points. The most important characteristic of a series is its type, which determines a particular visual representation of data. You can find more details on each series type in the corresponding topics in the Chart Series help section.
To define a single series, create an instance of the BootstrapChartSeries class. In the series’ object, specify the series type, data source fields, the appearance of the series points and other options.
To show several series, specify series as an array of objects defining series. If you need to set similar values to properties of several series, use the BootstrapChartCommonSeries class. It exposes the properties that can be specified for all series at once and for all series of a particular type at once. Note that the values specified for a series individually (in the series array) override the values that are specified for all series (in the BootstrapChartCommonSeries class).
Note
This property is required. If you do not need to specify any of the options within the SeriesCollection array (e.g., when you have specified them within the BootstrapChartCommonSeries object), assign at least an empty object to the SeriesCollection property.
Example
This example demonstrates the basic functionality of the Chart control.
- Initilize a new instance of the BootstrapChart class.
- Bind the chart control to the required data storage. For this purpose, assign the URL of your data storage (in this demo, a JSON file) to the BootstrapWebClientUIWidget.DataSourceUrl property.
- Define chart axes. For this purpose, use the BootstrapChartArgumentAxis and BootstrapChartValueAxis classes.
- Add required series to the
BootstrapChart.SeriesCollectionarray. - Use other available BootstrapChart class properties to customize the chart. For instance, you can swap chart axes by setting the BootstrapChart.Rotated property to true.
The image below shows the result:
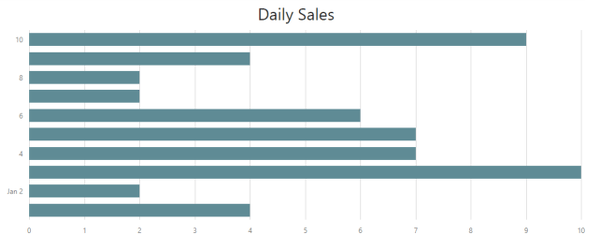
<dx:BootstrapChart runat="server" DataSourceUrl="~/jsondata/simple.json" TitleText="Daily Sales" Rotated="true">
    <ArgumentAxis ArgumentType="System.DateTime" MaxValue="2017-01-10" />
    <ValueAxisCollection>
        <dx:BootstrapChartValueAxis TickInterval="1" />
    </ValueAxisCollection>
    <SeriesCollection>
        <dx:BootstrapChartBarSeries ArgumentField="date" ValueField="sales" />
    </SeriesCollection>
    <SettingsLegend Visible="false" />
</dx:BootstrapChart>