Zooming and Scrolling
- 2 minutes to read
The Chart control allows scrolling and zooming its content. These capabilities have contiguous functionality and should be enabled simultaneously. This topic consists of the following sections:
Zooming
Zooming is disabled by default (the BootstrapChart.ZoomingMode property is set to None). To enable scrolling, set the BootstrapChart.ZoomingMode property to one of the following values:
- All - enables zooming for all device types.
- Mouse - enables zooming for desktop devices only (zoom the chart using the mouse wheel).
- Touch - enables zooming for touch-enabled devices only (zoom the chart using the spread/pinch gesture).
The following code sample implements the chart’s zooming capability:
<dx:BootstrapChart ID="ChartLine" runat="server" DataSourceUrl="~/Content/fullstackedbar.json" TitleText="Energy Consumption in 2004" SubtitleText="(Millions of Tons, Oil Equivalent)" ZoomingMode="All">
    <SettingsCommonSeries ArgumentField="country" />
    <SeriesCollection>
        <dx:BootstrapChartLineSeries ValueField="hydro" Name="Hydro-electric" />
        <dx:BootstrapChartLineSeries ValueField="oil" Name="Oil" />
        <dx:BootstrapChartLineSeries ValueField="gas" Name="Natural gas" />
        <dx:BootstrapChartLineSeries ValueField="coal" Name="Coal" />
        <dx:BootstrapChartLineSeries ValueField="nuclear" Name="Nuclear" />
    </SeriesCollection>
    <ArgumentAxis ValueMarginsEnabled="false" DiscreteAxisDivisionMode="CrossLabels" GridVisible="true" TickInterval="1" />
    <SettingsLegend HorizontalAlignment="Center" VerticalAlignment="Bottom" ItemTextPosition="Bottom" />
    <ValueAxisCollection>
        <dx:BootstrapChartValueAxis TitleText="millions" />
    </ValueAxisCollection>
</dx:BootstrapChart>
Scrolling
Scrolling allows an end-user to navigate the zoomed chart’s content.
Scrolling is disabled by default (the BootstrapChart.ScrollingMode property is set to None). Set the BootstrapChart.ScrollingMode property to one of the following values to enable scrolling:
- All - enables scrolling for all device types.
- Mouse - enables scrolling for desktop devices only (scroll the chart by dragging the chart).
- Touch - enables scrolling for touch-enabled devices only (scroll the chart using the flick gesture).
To display a scroll bar, set the BootstrapChartScrollBarSettings.Visible property to true. You can also customize a bar’s position and offset using the corresponding BootstrapChartScrollBarSettings class properties.
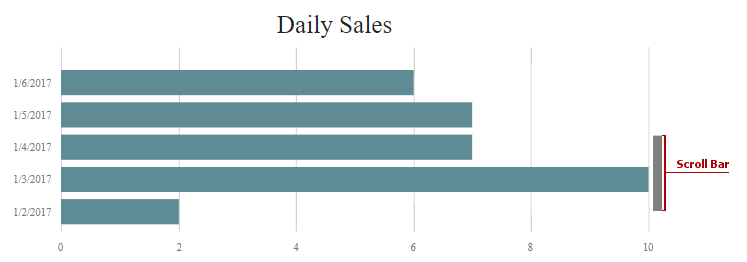
Use the following code to implement the chart above:
<dx:BootstrapChart runat="server" DataSourceUrl="~/Content/simple.json" TitleText="Daily Sales" Rotated="true" ScrollingMode="All" ZoomingMode="All">
    <ArgumentAxis ArgumentType="System.DateTime" MaxValue="1/10/2017" >
        <Label>
            <Format Type="ShortDate" />
        </Label>
        </ArgumentAxis>
    <ValueAxisCollection>
        <dx:BootstrapChartValueAxis TickInterval="1" />
    </ValueAxisCollection>
    <SeriesCollection>
        <dx:BootstrapChartBarSeries ArgumentField="date" ValueField="sales" />
    </SeriesCollection>
        <SettingsScrollBar Visible="True" />
    <SettingsLegend Visible="false" />
</dx:BootstrapChart>