Server Functionality
The Bootstrap Charts suite provides server-side wrappers for DevExptreme Chart widgets allowing you to configure your charts using Visual Studio design time tools, ASPX markup and code-behind. The code sample below demonstrates how you can create a chart, configure it, and bind it to data (a local JSON file) in server markup.
<dx:BootstrapChart runat="server" DataSourceUrl="~/jsondata/data.json" TitleText="Daily Sales" Rotated="true">
    <ArgumentAxis ArgumentType="System.DateTime" MaxValue="2017-01-10" />
    <ValueAxisCollection>
        <dx:BootstrapChartValueAxis TickInterval="1" />
    </ValueAxisCollection>
    <SeriesCollection>
        <dx:BootstrapChartSeries ArgumentField="date" ValueField="sales" Type="Bar" />
    </SeriesCollection>
    <SettingsLegend Visible="false" />
</dx:BootstrapChart>
Additionally, the DevExpress Bootstrap Charts suite includes the Chart Designer that provides a visual interface for configuring charts. To invoke the designer, select a chart control, click its smart tag and select Designer in the invoked menu.
The designer includes sections allowing you to manage collections of chart series and value axes. Each collection item can be individually configured using the Item Properties panel.
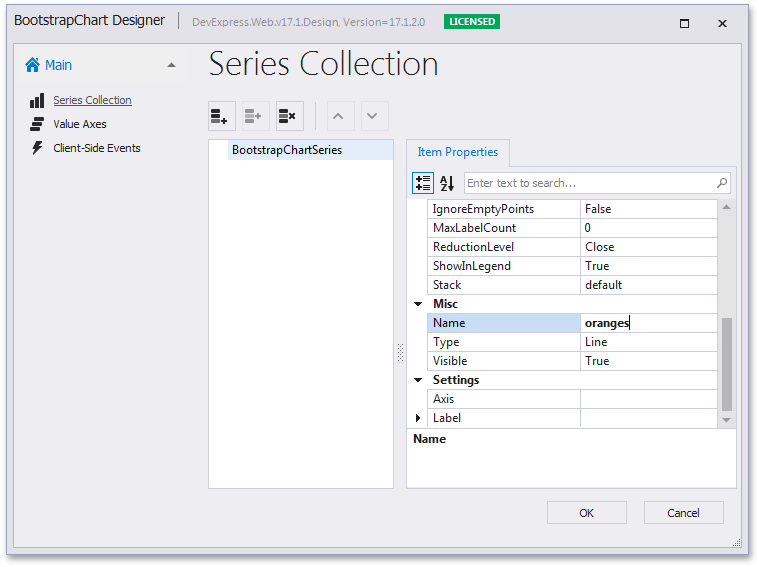
After you close the Chart Designer by clicking OK, the chart’s ASPX markup reflects all changes made in the designer.