Chart Series
A series represents a group of related data points. The most important characteristic of a series is its type, which determines a particular visual representation of data.
You can access the chart series’ collection using the chart’s SeriesCollection property. Use this property to specify settings of an individual series.
<dx:BootstrapChart ID="BootstrapChart1" runat="server" ... >
    <SeriesCollection>
        <dx:BootstrapChartSeries Type="Area" ValueField="y1564" Name="15-64 years"  ... />
    </SeriesCollection>
    ...
</dx:BootstrapChart>
You can also specify particular options to be common for all series using the chart’s SettingsCommonSeries property.
<dx:BootstrapChart ID="BootstrapChart1" runat="server" ... >
    <SettingsCommonSeries Type="Area" ... >
    ...
</dx:BootstrapChart>
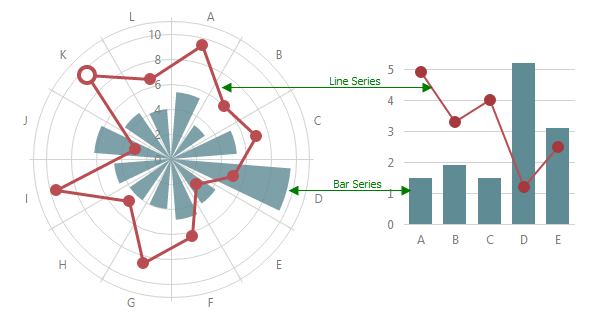
All specified series use the same value axis by default. However, you can plot series with different value axes in one pane as well. For this purpose, define the value axes and specify the BootstrapChartSeriesBase.Axis property for each series.
<dx:BootstrapChart ID="BootstrapChart1" runat="server" ...>
    <SeriesCollection>
        <dx:BootstrapChartSeries Type="Line" Axis="mainAxis" ... />
        <dx:BootstrapChartSeries Type="Bar" Axis="secondaryAxis" ... />
    </SeriesCollection>

    <ValueAxisCollection>
        <dx:BootstrapChartValueAxis Name="mainAxis" />
        <dx:BootstrapChartValueAxis Name="secondaryAxis" />
    </ValueAxisCollection>
    ...
</dx:BootstrapChart>
See Also